![]()
 Food, obesity and physical activity
Food: Headlines
Food and nutrition, and our levels of physical activity, are second only to smoking tobacco in the impact on our health. A combination of eating too much energy as calories and a lack of physical activity leads to obesity, diabetes, heart disease, stroke and some cancers. Eating habits established in childhood and adolescence tends to continue and affect adult health. Individuals with irregular meal patterns are more likely to become overweight and obese.
Locally, just over 1 in 5 14-year- olds in 2009 were rarely eating breakfast or sitting down to eat a family meal. Likewise, 1 in 6 (17%) adults in Kirklees either never cooked a meal from basic ingredients or did so less than once a week. 1 in 5 (19%) adults in Kirklees ate fast food or takeaways at least once a week.
Poor oral health is also an indicator of poor nutrition. Batley and Dewsbury had worse oral health than the other areas. The number of decayed/missing/filled teeth of children under five was 3.8 in Batley and 3.0 in Dewsbury, compared with 1.5 nationally in 2006.
Eating fruit and vegetables was linked to household income, with those on lower incomes eating less. Access to healthy food was poorer in the more deprived areas with residents of Dewsbury reporting greater use of takeaways, being least confident in preparing a meal from basic ingredients and reporting the lowest likelihood of eating five items of fruit and vegetables a day. Women of childbearing age remained a key group for concern, particularly women with young children, as they were key shapers of family behaviour. Barriers included a lack of cooking skills, budgeting and perceived expense of a healthy diet. Local women also quoted fussy families as blocks. Poor nutrition in the mother affects her infant and their risk of disease in later life.
Food: Why is this issue important?
A balanced diet is essential for health and wellbeing. Good nutrition and level of physical activity have a key role to play in both the prevention and the management of disease and are second only to smoking tobacco in their impact on health. A combination of eating too much (energy as calories) and a lack of physical activity leads to obesity, diabetes, heart disease, stroke and some cancers1. Nationally, 1 in 3 deaths from cancer may be attributable to poor diet2. This is due to people consuming more than the recommended amount of saturated fat, salt and added sugar together with low levels of fruit, vegetables, oily fish and fibre. The availability of processed foods, perceived expense of a healthy diet and a lack of knowledge and skills to enable people to benefit from a better diet contribute to the issue.
Nutrition is one of the key areas that can profoundly affect the health of the unborn child and can affect the child’s later health, as well as the health of the child’s children3. Eating habits established in childhood and adolescence tend to continue into adulthood and therefore affect adult health. Diet also plays a significant role in oral health. Good nutrition prevents many dental problems and is important from infancy through to adulthood and beyond.
Food: What significant factors are affecting this issue?
Food behaviour is associated with other health related behaviours, especially physical activity, alcohol consumption and smoking. There are increased requirements for some nutrients, including folic acid and vitamin D, before and during pregnancy. Recent studies emphasised the importance of vitamin D during pregnancy3, as well as throughout life4.
Lower than average reported intake of vitamins (A, C, D, B6, B12 and folate) and minerals (iron) combined with a higher sodium intake are specific issues for low-income households. This is because households in receipt of benefits are less likely to eat foods like fruit and vegetables and wholemeal foods and more likely to eat processed and sugary foods5. Individuals with irregular meal patterns are more likely to become overweight and obese. Just over 1 in 5 of local 14-year -olds in 2009 rarely ate breakfast or sat down to eat a family meal6.
Eating fruit and vegetables is one indicator of eating a balanced diet. Nationally, data from the 2010 Health Survey for England demonstrated that only 26% of adults ate the recommended five or more portions of fruit and vegetables daily7. The average UK household bought four portions of fruit and vegetables per person per day but in the lowest income families this fell by 20% between 2006 and 2010 (to 2.7 portions)8. In Kirklees in 2012:
- 2 in 3 (64%) adults reported eating five or more portions of fruit and vegetables a day9
- Over half (55%) of 14-year- olds reported eating five or more portions of fruit and vegetables a day compared with only 1 in 6 (15%) nationally10. This local figure rose from 40% in 20056. Local data has limitations as it is self-reported. It might overstate consumption of foods that are healthy and understate consumption of foods that are unhealthy. Self-reporting may also reflect an awareness of the 5-a-day message, rather than personal actions. In spite of these limitations, local data allows us to compare food behaviour across groups locally.
The large number of hot food takeaways established in Kirklees can further influence unhealthy food choices. Locally, 36% of the food outlets in Kirklees were hot food takeaways many of which were in the most deprived areas. Overall 1 in 5 (19%) adults in Kirklees ate fast food or takeaways at least once a week. In Dewsbury and Spen Valley, this increased to 1 in 4 (23%) adults. In Kirklees, 1 in 7 (14%) adults said they felt not at all confident or not very confident cooking from basic ingredients and 1 in 6 (17%) adults either never cooked a meal from basic ingredients or did so less than once a week9.
Food: Which groups are most affected by this issue?
Dietary inequalities contribute to overall inequalities in health outcomes and the National Diet and Nutrition Survey demonstrated evidence of low nutrient status for the following groups:
- Iron: There was evidence of iron-deficiency anemia and low iron stores in a proportion of adult women and older girls which has health implications for these groups11.
- Vitamin D: There was evidence of low vitamin D status in adults and older children, both male and female, which have implications for bone health, particularly increased risk of rickets and osteomalacia11. Low plasma vitamin D levels have also been found in young children, with 2% of UK children aged between 1½ and 4½12, and 20-34% of Asian children aged 2 13 having low plasma vitamin D levels, primarily due to insufficient skin exposure to direct sunlight.
- Vitamin B2: A substantial proportion of adults and older children had low vitamin B2 (riboflavin) status. The health implications of this are not known11.
Women of childbearing age (WoCBA)9
The nutritional status and behaviour of our mothers determine our future patterns of nutrition14 (p26). Mothers tend to model eating behaviours in families. Therefore, supporting women of childbearing age to know and practice healthy eating can influence future health.
Locally, WoCBA were the least likely to:
- Eat fruit and vegetables each day. More than 1 in 3 WoCBA (40%) were unlikely to consume five or more portions
- Eat a meal with family or other household members. 1 in 9 WoCBA (12%) ate together either less than once a week or never.
In addition, WoCBA were the most likely to:
- Eat fast food and takeaways. 1 in 5 WoCBA (21%) ate fast food or takeaways at least once a week
- Feel unconfident preparing meals using basic ingredients. 1 in 9 (11%) did not feel confident cooking using basic ingredients.
- Drink fizzy drinks. WoCBA had the highest consumption of fizzy drinks
Vulnerable adults9
Poor access to healthy food, lack of skills and low motivation to prepare meals can influence the food choices of more isolated individuals, especially the very old who experience high rates of malnutrition and poor diet14(p32). The health and quality of life of the elderly living alone and adults with low-level mental health problems can improve if they are supported to eat a balanced diet. . Locally, older people aged 65 were the least likely to eat as a household. 1 in 7 older adults never ate with family or household members. In addition, 1 in 5 (22%) men aged 65 felt unconfident cooking from basic ingredients. Of those who reported that they needed help or support to continue to live in their own home, 1 in 4 (23%) reported that they needed support with eating and half (54%) reported that they needed help to prepare food.
Black and minority ethnic (BME) groups9
In Kirklees, a large proportion of black and minority ethnic groups live in the more deprived communities where access to healthy food is poor. Traditional foods in the south Asian and African-Caribbean communities and the methods by which they are cooked can also lead to a diet high in fat, salt and sugar so these groups have a higher risk of obesity and diabetes.
Locally the black community were the most likely to drink fizzy drinks daily (57% of adults) and were the least likely to eat as a household, with only 1 in 3 adults (39%) eating together at least 5 times a week. In addition, 3 in 4 (75%) adults felt unconfident cooking from basic ingredients.
The income deprived9
Nationally, households receiving benefits were less likely to eat fruit, vegetables, and wholemeal foods and were more likely to consume processed and sugary foods10. People on low incomes were more likely to report that they skipped meals for a whole day and found it difficult or were reluctant to buy fresh or unfamiliar foods. Lower income households were the hardest hit by food price fluctuations15 (p82). Locally in 2012, 2 in 3 (66%) of households with incomes of £20,001-£30,000 reported that they were likely to eat five or more portions of fruit and vegetable each day. This dropped to 1 in 2 (54%) of households with incomes under £10,000.
Food: Where is this causing greatest concern?
- Batley and Dewsbury had worse oral health than other areas. The number of decayed/missing/filled teeth of children under five was 3.8 in Batley and 3.0 in Dewsbury, compared with1.5 nationally in 2006. Fizzy drink consumption was linked to poor oral health. Nearly half of adults drank fizzy drinks daily in Dewsbury (43%) and Batley (42%). This was almost double the number in the Holme Valley (24%)9.
- Almost half of 14-year olds in Batley (49%) and Dewsbury (48%) reported eating five or more portions of fruit and vegetables a day. Over one in three did so in the Holme Valley (69%)6. Dewsbury also had the lowest number of adults reporting five a day (57%). Holme Valley reported the highest at almost 3 in 4 (73%)9.
- Dewsbury and Spen Valley reported the highest consumption of fast food and takeaways with 1 in 4 (23%) adults eating them at least once a week compared with 1 in 8 (13%) in Mirfield.
- 1 in 10 (10%) adults living in Dewsbury never cooked a meal from basic ingredients and 1 in 5 (19%) adults did not feel confident preparing a meal from basic ingredients.
Food: Views of local people
NHS Kirklees consulted members of the public to find the best way to support women with children to improve their understanding of healthy eating. Their thoughts included developing cooking skills and raising confidence and self-esteem in providing healthy family food. This included budgeting skills, cost-effective shopping, advice on weaning and fussy eaters, and recipe adaptation. Local women highlighted these barriers again when they were asked about healthy and unhealthy foods and the cost of a healthy diet. 13.
- “I just binge ate all the time: everything; pizzas, burgers, MacDonald’s… I sort of moved out with my ex-partner… [I was], 17-18… I didn’t learn to cook when I were younger and stuff like that… I didn’t have the skills to do nothing.” (18-25- year-old, no children, Spen Valley).
- “All the junk food is cheap and all healthy food is expensive.” (18-25-year-old, no children, Spen Valley).
- “You eat fruit five a day and it is expensive. So tell me how single mums are supposed to afford those expensive fruit and veg. You are not able to…” (18-25-year-old, mother, Huddersfield North).
- “So when you were pregnant did you eat differently?” “I did first of all but when you are pregnant and you have a two-year-old, you are knackered all the time. When he is eating his tea, you have an extra ten minutes to wash up or something so you don’t take advantage of the time that you have got…” (18-25-year-old, mother, Huddersfield North).
Local insight from women of childbearing age in north Kirklees concluded that awareness of the nutrients needed during pregnancy was very limited16. In addition, very few women admitted to making major changes to their diet, with the demands of existing family taking precedence over their needs as pregnant women.
Food: What could commissioners and service planners consider?
- Work in collaboration with a wide range of organisations and stakeholders to develop and implement the Kirklees Food Strategy and Action Plan.
- Ensure that evidence based messages and the Eat well Plate are used to promote consistent messages concerning a diet, nutrition and healthy eating.
- Increase the promotion and sign up to the Healthy Start Scheme in Kirklees to enable all pregnant women and parents with children under the age of four to access vitamin supplements, particularly to those in priority groups.
- Ensure interventions to improve nutrition prioritise the groups highlighted above who have been shown to have the poorest diet.
- Use understanding about beliefs, attitudes, barriers and motivators to food and nutrition to commission insight led, person centred interventions to maximise behaviour change.
- Continue to develop interventions that improve the nutritional knowledge and food preparation skills of priority groups.
- Work with takeaway and other food outlets to improve the nutritional quality and labelling of the food served to enable consumers to make healthier, informed choices.
Food: References
- World Health Organisation (WHO) (2002) Diet, Nutrition and the prevention of chronic diseases. Report of a WHO Study Group Geneva.
- Department of Health (2000) NHS Cancer Plan. London: Department of Health.
- Collis, D. and Hooper, J. (2008) Infant Deaths in North Kirklees. Kirklees PCT.
- Gregory, J. R., Lowe, S., Bates, C. J., Prentice, A., Jackson, L. V., Smithers, G., Wenlock, R., and Farron, H. (2000) National Diet and Nutrition Survey: Young People aged 4-18 years Report of the Diet and Nutrition Survey 2. London: The Stationary Office.
- Acheson, D. (1998) Independent Inquiry into Inequalities in Health Report. TSO, London.
- NHS Kirklees, Kirklees Council and West Yorkshire Police. Young People’s Survey (YPS). 2009.
- The NHS Information Centre (2012) Statistics on Obesity, Physical Activity and Diet: England 2011. The Health and Social Care Information Centre.
- Food Standards Agency (2007) Low Income Diet and Nutrition Survey. London: TSO. ISBN 978 011 703783 0.
- NHS Kirklees and Council. Current Living in Kirklees survey (CLIK). 2008.
- Department of Health, 2008/2009, National Diet and Nutrition Survey – headline results from year 1 of the rolling programme. Edited by Beverly Bates, Alison Lennox and Gillian Swan.
- Department of Health (2011). National Diet and Nutrition Survey: headline results from years 1 and 2 (combined) of the rolling programme, 2008/09 – 2009/10; Supplementary report: Blood Analytes. Crown
- Holick M.F. (2004) Sunlight and vitamin D for bone health and prevention of autoimmune diseases, cancers and cardiovascular disease. American Journal Clinical Nutrition; 80(suppl):1678S-88S.
- Lawson, M., and Thomas, M. (1999) Vitamin D Concentrations in Asian Children aged 2 years living in England British Medical Journal, 28: 318-322
- Department of Health. Our Health and Wellbeing Today. London: DH Publications 2010.
- Marmot M. (2010) Fair Society, Healthy Lives: Strategic Review of Health Inequalities in England post 2010. http:/www.marmot-review.org.uk/
- 20/20 Research Limited (2008). Exploratory Research into Health of Women of Childbearing Age in Kirklees.*
*Respondents were aged 18-40 years. Respondents were split into equal groups of smokers and non-smokers. All respondents were residents of Huddersfield North, Dewsbury, Batley or Spen, residing in MOSAIC postcode types D26, D24, D23. Respondents either had children or were considering having children within the next three years. The insight involved a programme of 16 qualitative groups (including four groups with ethnic populations – two Indian, two Pakistani), complemented with 12 depth interviews.
Food: Date this section was last reviewed
08/07/2013 (PL)
Obesity: Headlines
The rise in obesity is one of the biggest threats to health in the UK. Without clear action, the rates of obesity will rise to almost 9 in 10 adults and 2 in 3 children by 2050.
Obesity is associated with an increased risk of earlier death and a range of diseases that have a significant health impact on individuals, such as diabetes, heart disease, cancer and muscular skeletal problems. Additionally, the risk of maternal death from childbirth and infant death are increased. Obesity shortens life expectancy by nine years on average.
Locally, in 2012, over half (54%) of all adults were overweight or obese, which remained unchanged from 2008 suggesting a halt in the rise of obesity in Kirklees.
Locally 1 in 5 5-year olds and 1 in 11 14 year olds were overweight or obese in 2011.
Obesity: Why is this issue important?
The rise in obesity is one of the biggest threats to health in the UK. In England in 2009 2 out of 3 (66%) men and over half (57%) of women were overweight, of which almost a quarter, 22% of men and 24% of women, were obese1. 4 in 5 obese teenagers go on to be obese adults. Without clear action, the rates of obesity will rise to almost 9 in 10 adults and 2 in 3 children by 20502.
Locally, in 2012, over half (54%) of all adults were overweight or obese, especially those aged 46-64 years, over 65 years and men, which remained unchanged from 2008 suggesting a halt in the rise of obesity in Kirklees3. 1 in 5 5-year olds and 1 in 3 11-year olds were overweight or obese in 20114.
Obesity is associated with an increased risk of a range of diseases that have a significant health impact, including earlier death, on individuals such as diabetes, heart disease, cancer, muscular skeletal problems, and maternal death from childbirth and infant death.
Annually, obesity is responsible for 9,000 deaths in those aged under 65 years in England, and reduces life expectancy by nine years on average5. It is responsible for the recent rise in maternal deaths. Obese people can experience stigmatisation and bullying, which can lead to depression and low self-esteem. Those with diabetes were twice (40%) as likely to be obese than the overall population (18%), which has important consequences for their risk of further ill health.
The most recent Government publication, “Healthy lives, healthy people: a call to action on obesity in England”6 has two ambitions for a sustained downward trend in the level of excess weight in children by 2020 and a downward trend in the level of excess weight averaged across all adults by 2020.
Obesity: What significant factors are affecting this issue?
Obesity is caused by the imbalance between calories (or energy) taken into the body and calories used by the body and burnt off in physical activity, over a prolonged period. Excess energy results in the accumulation of excess body fat. Therefore it is an individual’s biology, for example, genetics and metabolism, and their eating and physical activity behaviour that are primarily responsible for maintaining a healthy body weight.
Body mass index (BMI) is used to measure whether people are overweight (BMI 25-30) or obese (BMI >30), and relates weight to height.
Addressing obesity links to several behaviour programmes, particularly food, alcohol and physical activity (see behaviours section). Locally only 1 in 4 obese people did the recommended amount of physical activity in 2012, which is less than the 1 in 5 in 2008; and remained the lowest out of all the weight categories3. Significant external influences such as environmental and social factors, for example, changes in the availability of food, motorised transport and work/home lifestyle patterns, can also influence body weight, known as the obesogenic environment.
Obesity: Which groups or communities are most affected by this?
Children and young people6
Locally, in 2011, more than 1 in 5 (21%) 4-5 year olds living in Kirklees were either overweight or obese, 2% lower than in 2008/097 but this is not statistically significant. Over 1 in 3 (32%) 10-11 year olds were either overweight or obese in 2011, which was also lower than in 2008/097 but not significantly so.
As children move into secondary school weight management continues to be a concern across Kirklees. In 2009, 1 in 5 (18%) 14-year olds reported that they were on a diet or trying to lose weight, but they may not necessarily need to8. Nationally, 4 in 5 obese teenagers went on to be obese adults9.
Adults3
Locally, in 2012, 19% of all adults were obese; highest in those aged 45-64 years (22%) compared to 18% in those aged 18-44 years and 17% in those aged 65 years and over. 1 in 3 (35%) of all adults living in Kirklees were overweight; so over half of all adults were overweight or obese. These figures have not changed much since 200810.
More men living in Kirklees were overweight and obese (61%) compared to women (46%). Those with diabetes, long-term pain, and heart disease were far more likely to be obese or overweight, almost 3 in 4 of those with diabetes, high blood pressure or cardiovascular disease and 2 in 3 people with pain. 1 in 3 obese people stated that a health condition affected their ability to carry out day-to-day activities.
Women of childbearing age3
Locally, 2 in 5 (40%) women in Kirklees, aged 18-44, were overweight or obese in 2012 – also unchanged from 2008. This is important for the future health of any potential unborn children.
Families
The likelihood of a child being obese is strongly linked to whether their parents are overweight or obese; 1 in 4 children who have both parents overweight or obese are obese themselves, compared with 1 in 20 who have no parent overweight or obese11.
Ethnicity3
People from black African and black Caribbean communities were more likely to be obese (27%) than the general population (18%). Obesity was higher in Pakistani mothers of infants who died12.
Income
1 in 4 (23%) of those who were obese were in the most deprived quintile of the index of multiple deprivation (IMD). 1 in 8 (12%) obese people were more than twice as likely to be permanently sick or disabled as those of a healthy weight (5%)3.
Obesity: Where is this causing greatest concern?
Obesity is an issue across all localities. However Dewsbury had the highest rate of obese young people and adults and Batley had the highest number of obese children; nearly 1 in 11 (9%) children aged 4-5 years and 1 in 5 (19%) children aged 10-11 years were obese4. Over 1 in 5 (19%) adults were obese and 22% of adults living in Dewsbury were obese3. Mirfield has one of the lowest levels of obese (16%) but has over half either overweight or obese indicating a high population of overweight people.
Obesity: Views of local people
NHS Kirklees commissioned a series of consultations with obese children, their families and adults to understand the barriers and motivations to weight loss13. These consultations found that:
- adults were put off services by the humiliation of the “weigh-in” and people attending classes who were not seen as very overweight
- cost is a barrier to adults attending weight management programmes
- men perceive conventional weight management services as inappropriate and wanted material targeted at them
- parents feel that there is a lack of activities for children and they feel reluctant to allow children to play out
- children and young people feel they comfort eat as a result of emotional issues i.e. problems with parents and bullying
- parents believe weight gain is a result of an external uncontrollable factor i.e. genetics or medication. Children give other reasons such as availability of cheap junk food, laziness and their parents working long hours, resulting in them eating whatever they can find when they return from school and turning to easy fast food for evening meals.
Obesity: What could commissioners and service planners consider?
Innovative approaches to education and raising awareness are needed to motivate the target groups. Key partners and service planners should maximise opportunities to deliver key messages to encourage the public to take personal action and highlight the effective help available to support them. These include national campaigns such as the Change4Life movement14 and local initiatives such as the Healthyweight4Kirklees15 website and network which provide advice, support and links to local services.
Obesity: References
- Health Survey for England. http://www.hscic.gov.uk/Article/1685
- Government Office for Science. Foresight Tackling Obesities: Future Choices. Department of Innovation University and Skills; 2007.
- NHS Kirklees and Kirklees Council. Current Living in Kirklees (CLIK) Survey; 2012.
- NHS Kirklees. National Child Measurement Programme (NCMP) 2010/11 School Year; 2012.
- Marmot M. Fair Society, Healthy Lives: Strategic Review of Health Inequalities in England Post 2010; 2010. Available from: http://www.marmot-review.org.uk/
- Department of Health. Healthy Lives, Healthy People: A Call to Action on Obesity in England. HM Government; 2012.
- NHS Kirklees. National Child Measurement Programme (NCMP) 2008/09 School Year; 2009.
- NHS Kirklees, Kirklees Council and West Yorkshire Police. Young People’s Survey (YPS); 2009.
- Department of Health. Our Health and Wellbeing Today; 2010.
- NHS Kirklees and Kirklees Council. Current Living in Kirklees (CLIK) Survey; 2008.
- NHS Information Centre. The Health Survey for England: Obesity and Other Risk Factors in Children. The Information Centre; 2008.
- Vergis, M. Infant Mortality in Kirklees. NHS Kirklees.
- Enventure. A Qualitative Insight into Obesity; 2008.
- Change4Life Movement: http://www.nhs.uk/change4life/Pages/change-for-life.aspx
- Healthyweight4kirklees website: www.healthyweight4kirklees.nhs.uk
Obesity: Date this section was last reviewed
09/07/2013 (PL)
Physical activity: Headlines
Only 1 in 3 adults did the recommended level of physical activity. This was lower amongst women, lower socio-economic groups and those of south Asian origin.
Activity levels decreased rapidly with age.
One in 10 adults never did 30 minutes or more of moderate activity in an average week. This rose to 1 in 4 of those with heart disease or diabetes.
One in 8 (13%) 14-year-olds did less than 30 minutes activity each day.
Over half of all adults wanted to do more sport and active recreation.
Physical activity: Why is this issue important?
Regular physical activity of moderate intensity can bring about major health benefits by:1
- Reducing the risk of cardiovascular disease (coronary heart disease, hypertension, and stroke), diabetes and some cancers, especially colon cancer and breast cancer.
- Reducing the risk of death and ill health for those who are overweight or obese, helping to avoid weight gain and maintain weight loss.
- Supporting musculoskeletal health, protecting against osteoporosis and benefiting those with osteoarthritis and low back pain.
- Reducing the risk of depression and dementia in later life, being effective in the clinical treatment of depression and, more generally, making people feel better and feel better about themselves2.
Participation in sport has a range of additional benefits including increased educational attainment, reduced offending, and increased social capital and community cohesion.13
Physical activity: What significant factors are affecting this issue?
Several elements make up physical activity and sport: active living (gardening, DIY, occupational activity etc), active travel (walking, cycling), active recreation (dance, gym, walking, cycling, active play etc), informal sport (football kick about, casual badminton etc) and formal sport (football league, tennis tournament etc). These are affected by:
- Levels of knowledge and confusion about the sport and physical activity messages. A number of myths about physical activity continue.
- Provision of appropriate opportunities for various population groups.
- Activity opportunities in our daily lives are often ignored.
- Quality of the environment 3. Safe, attractive and interesting parks and streetscapes, along with good urban design, can be a key motivator for walking and cycling.
- Motivation and support to change activity behaviour is a key issue locally.
- Increasing evidence shows the importance of tackling sedentary behaviour, alongside promotion sport and physical activity. Across each age group, there is evidence that people can achieve recommended levels of physical activity but still put their health at risk if they spend the rest of the time sitting or lying down. The key issue is that some activity is better than none1.
Physical activity: Which groups are most affected by this issue?
Sport and active recreation14
Only 1 in 5 (19%) adults were active for 30 minutes or more three days a week. (This is the measure in NI 8 which has been used for several years as a benchmark by Sport England. However, it excluded active living and active travel.) Whilst this was slightly above regional and national rates, there were large differences between different groups in Kirklees. Between men (29%) and women (19%) the gap is larger than regionally and nationally. The gap locally between white and non-white groups is only 2% which is smaller than regionally and nationally. Participation at this level drops sharply with age (aged 16-25– 41%, 26-54 – 26%, 55+ – 11%). Adults in higher socio-economic groups (NS SEC 1-2) are more likely to be active (28%) than those in lower groups (NS SEC 5-8) (21%).
Half of all adults are sedentary (48%). Although this has declined slightly from 2005/6 when the Active People survey was first undertaken, it is still alarmingly high. The overall picture is very similar, with those much more likely to be sedentary being women (57%), people with a limiting disability (74%), over 55s (69%) and those in the lowest socio-economic groups (61%). On a more positive note, when adjusted for our population make up, slightly more adults in Kirklees are participating for 3 x 30 mins in Kirklees than expected. The gap between observed and expected is greater than our nearest statistical neighbours.
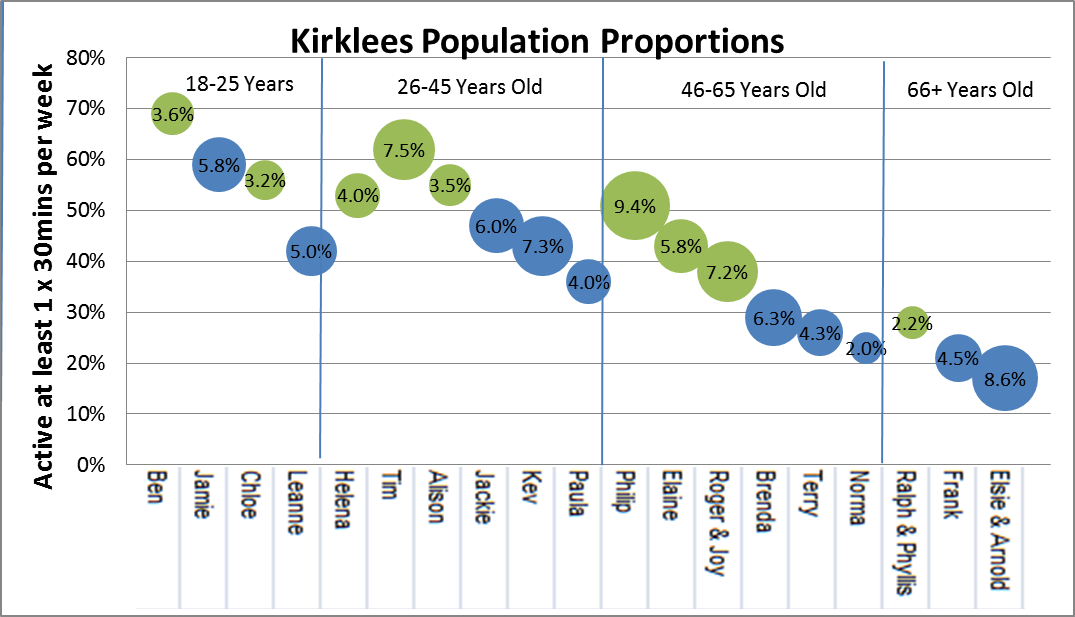
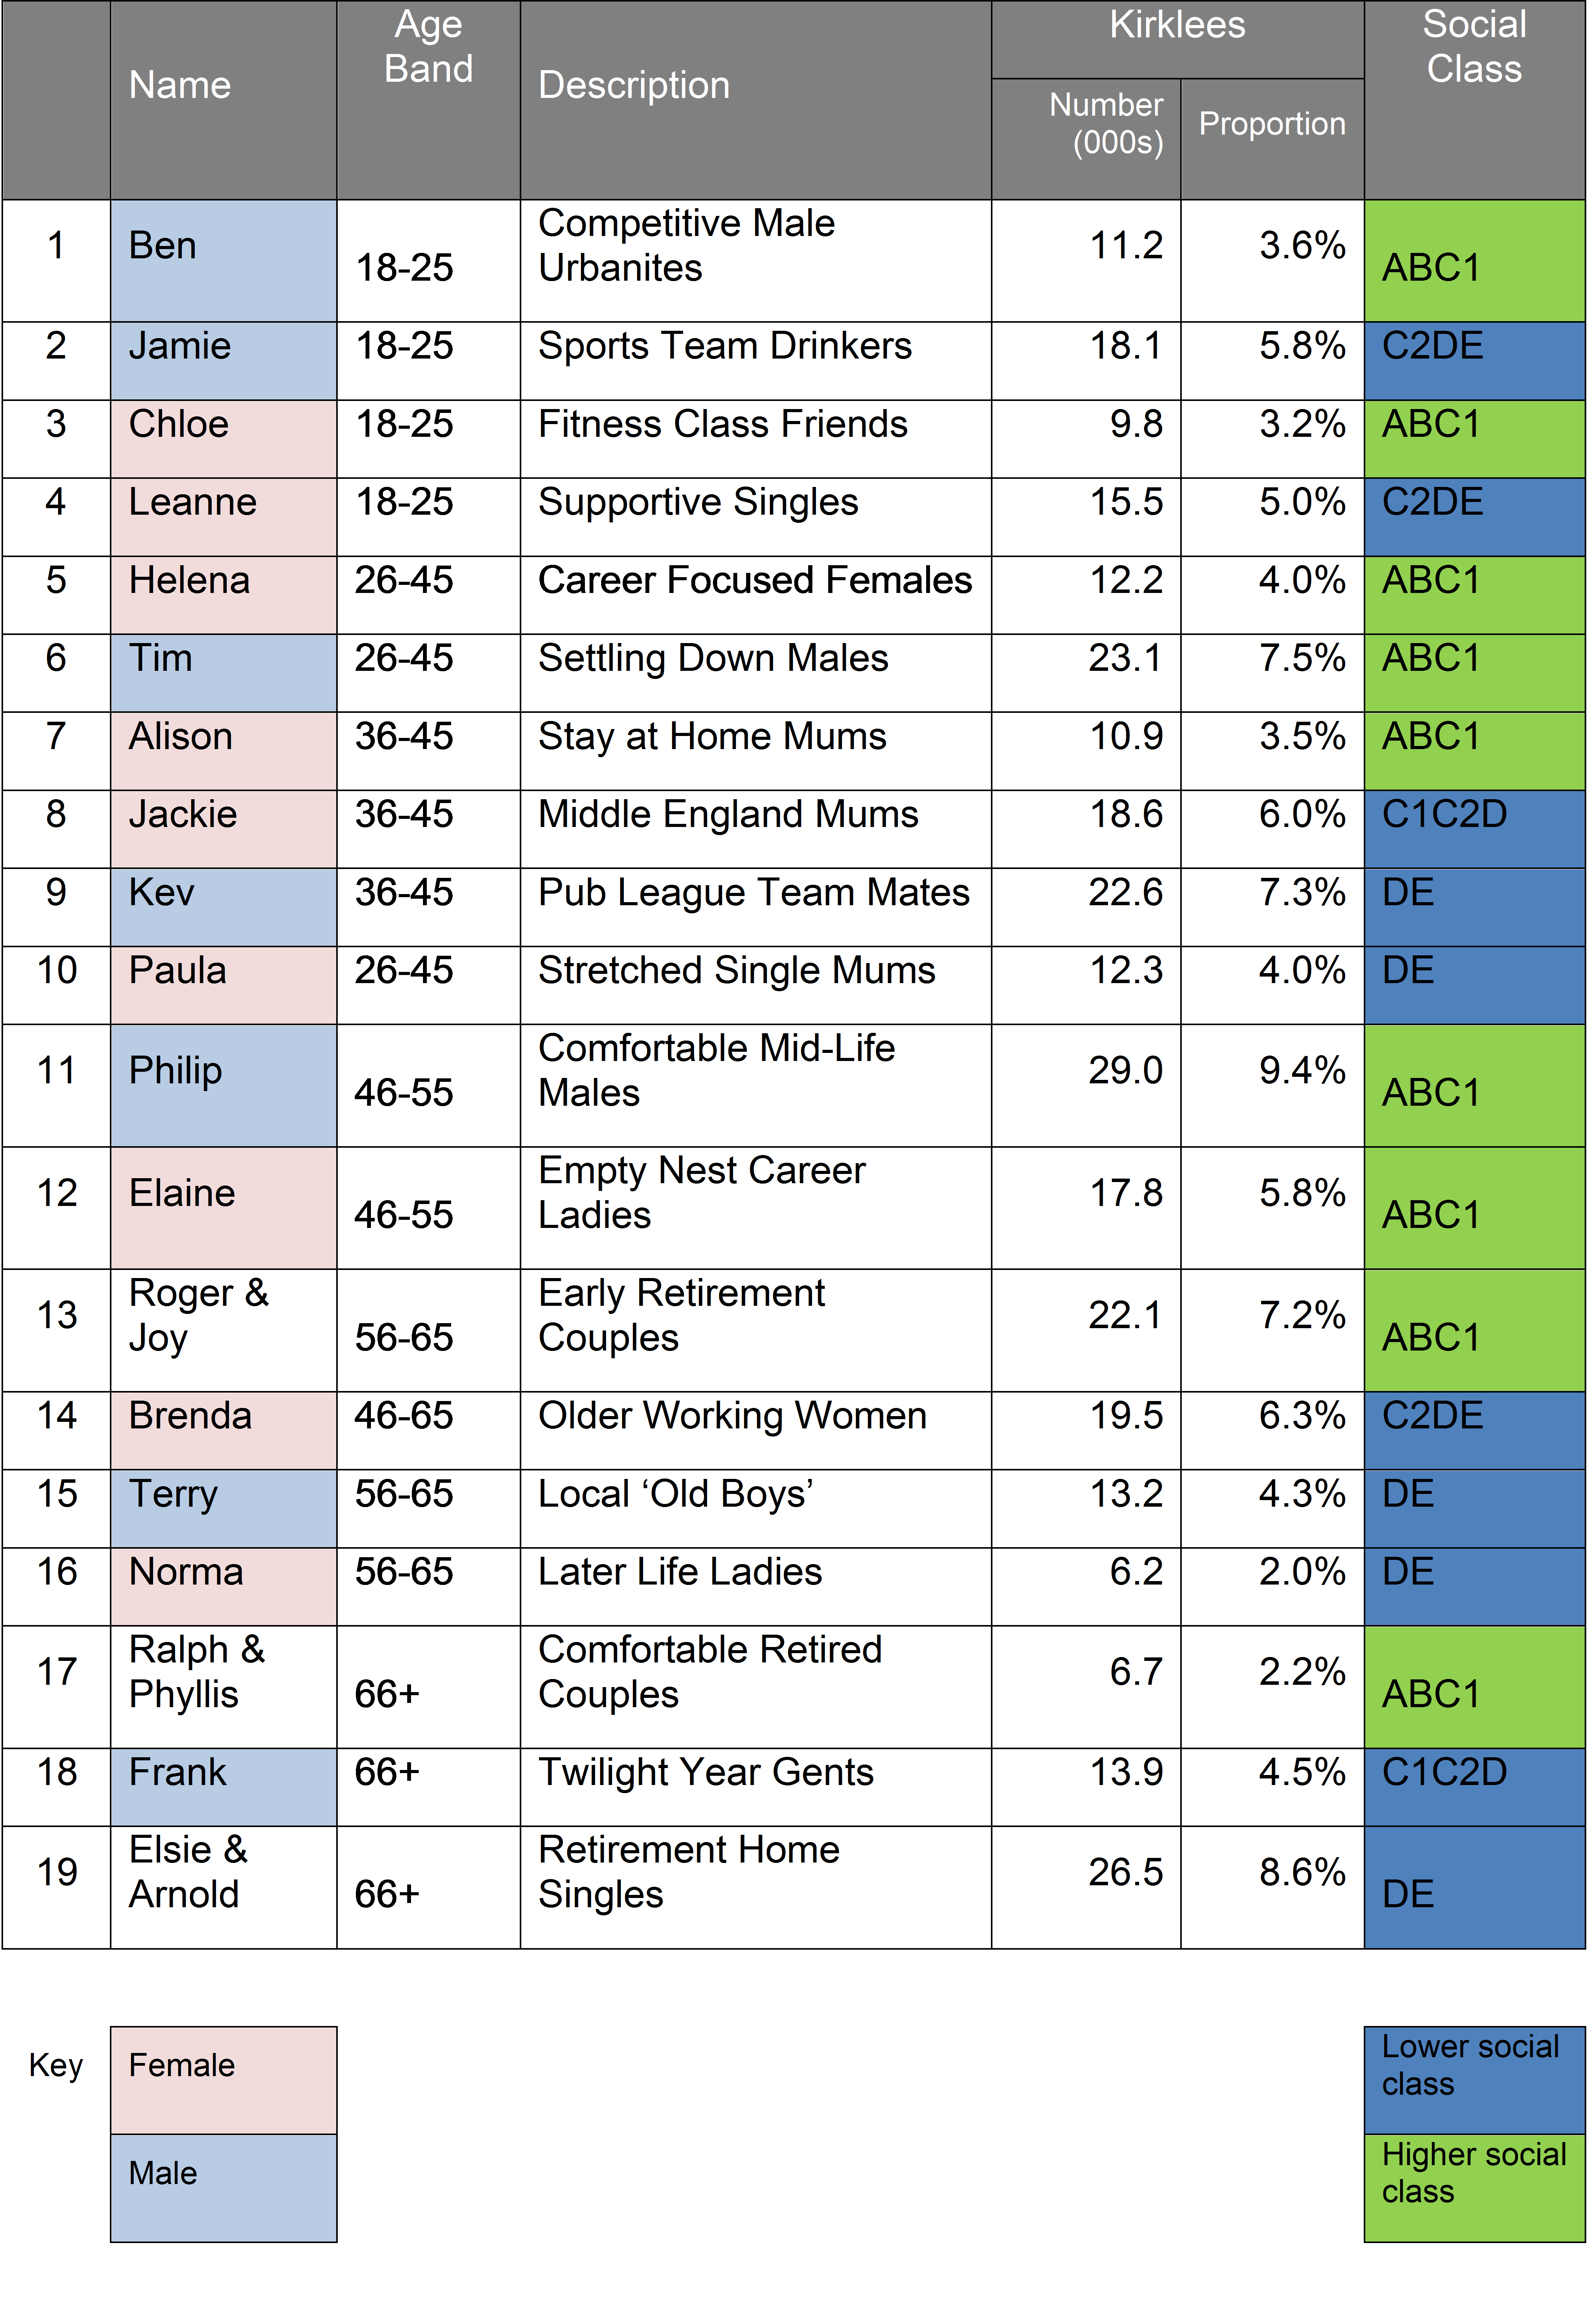
Sport England has developed 19 sporting segments to help us understand the nation’s attitudes to sport and active recreation, and their motivations and barriers (see below)15. The graph shows the proportion of the Kirklees population in each of the 19 segments and the percentage of that segment who are active at least once a week. This ranges from 7 out of 10 Bens (well educated men aged 18-25) participating once a week to fewer than 1 in 10 Elsie and Arnolds (retired people who live alone). The darker colour shows the lower socio-economic groups.
The overall picture was, again, that participation fell with age, women participated less than men and lower socio-economic groups also participated less.
The CLIK survey included all forms of activity (i.e. active living and active travel). But it still confirmed this overall picture7. Locally, 1 in 3 (35%) adults did the minimum recommended level of moderate activity of 30 minutes more than five times a week – more than in 2008 (28%). As age increased activity reduced4,5. Overall 1 in 10 adults (10%) locally did no physical activity at all, which was less than in 2008 (12%). Those groups who were most likely to be sedentary included those with bad/very bad health (41%), those claiming income related benefits (21%), and adults of Pakistani origin (17%)7.
Those who were sedentary were much more likely to have low levels of wellbeing. Those with low life satisfaction, not feeling things in life were worthwhile or unhappy were four times more likely to be sedentary. The opposite was the case for those who were active every day.
People who were obese were twice as likely as those who were a healthy weight to be sedentary.
The availability of suitable opportunities, good quality environments and motivation are essential in shaping activity levels. Locally14
- 1 in 5 (21%) of all adults were members of a sports related club, 1 in 14 (7.5%) volunteered for at least one hour a week in a sport/active recreation, 1 in 5 (19%) received some form of coaching/tuition in the last 12 months and 1 in 7 (14%) took part in an organised competition.
- Most adults wanted to do more sport or active recreation (54%) with cycling and swimming being the most frequently cited (9%).
- There were 481 sports specific facilities in Kirklees, and 122 clubs that met the Clubmark quality standard.
Children and young people6
Locally, in 2009:
- Only 66% of 14-year olds did the recommended amount of physical activity, i.e. 60 minutes each day, compared with 64% nationally in 20074.
- 1 in 8 (13%) of 14-year olds in Kirklees were sedentary, i.e. did less than 30 minutes activity each day.
- Girls spent less time in non-school organised activity, with 1 in 3 (33%) taking part for 60 minutes or more compared with nearly half of (45%) boys.
- Girls were less likely to take up a club or team activity – 1 in 12 (8%) compared with 1 in 8 (12%) boys.
- South Asian 14-year- olds spent less time in non-school organised activity, with only 1 in 3 (35%) taking part for 60 minutes or more compared with 2 in 5 of white (45%) and black young people (42%).
People with long-term conditions 7
Locally in 2012, those with certain long-term conditions were more likely never to do 30 minutes physical activity on any day than those who did not have such conditions:
- 1 in 4 adults with heart disease (26 – 35%) or diabetes (23 – 30%).Both these were improvements on the last CLIK survey (2008)
- 1 in 5 adults with CVD (19%) high blood pressure (18%) or with pain (22%).
- 1 in 6 (17%) adults with backache.
- 1 in 6 (19%) adults suffering from depression, anxiety or other nervous disorders
- 1 in 8 (15%) adults with asthma
Women of childbearing age 7
In 2012, as in 2008, locally, only 1 in 3 women aged 18-44 years reported doing the recommended levels of moderate physical activity weekly.
People with a low income 7
Lower socio-economic groups are less active2. Locally, in 2012, 13% in the most deprived quintile ‘never’ undertook recommended levels of moderate physical activity in comparison with 7% of those in the least deprived quintile.
Older people 7
Locally, in 2008, 1 in 4 (26%) of people aged over 65 did no physical activity compared with 1 in 14 (7%) of those aged under 65.
Black and minority ethnic people 7
In 2012, 38% of those who were white met the recommended level of physical activity while 10% never met the weekly recommended levels. Differences in ethnicities were evident. Corresponding figures for BME showed that only 29% met the recommended level with 15% ‘never’ taking part in moderate intensity physical activity. Further analyses of the data demonstrated that those who were black were more likely to meet the recommended level (41%).Those of mixed ethnicity (25%) and those who were Asian British (27%) had the lowest percentage taking part in recommended weekly physical activity levels.
Physical activity: Where is this causing greatest concern?
Physical inactivity is a cause for concern across all parts of Kirklees. There is a consistent pattern across most localities of around 1 in 10 adults never doing any activity.
Those who met the recommended levels were more likely to be from Mirfield, Denby Dale and Kirkburton, Colne Valley and Holme Valley; white and black men; aged over 65 and in the least deprived quintile.
Those who did not meet recommended levels were more likely to be from Batley, Dewsbury, Huddersfield and Spen; men aged over 65 and Asian British (16%).
Physical activity: Views of local people
“She is an angel when she has been allowed to run around in the park. If she is in all day, she is a nightmare.” (young mum, north Kirklees)*
Various groups of people were consulted about the barriers to becoming more active12 these were: women of childbearing age (WOCBA) 7, 8, people with long-term conditions (LTC) 7, older people (OP) 9, teenage girls (TG) 10, south Asian women (SA) 11 and 14-year- olds (CYP) 6. We found that:
- A key concern was having nobody to go with, particularly when starting or returning to physical activity after a break (WOCBA, OP, and LTC).
- Lack of suitable, culturally appropriate, gender specific activity opportunities (TG, SA, WOCBA).
- Fear of activity being detrimental to health and lack of knowledge on what and how much to do (LTC).
- Not aware of local opportunities (ALL).
- Not enough time to undertake physical activity (CYP, WOCBA).
- Inability to self-motivate, need someone to help and support, “someone like me”. (LTC, WOCBA).
- Lack of confidence: “I am not good enough”. (CYP, OP, TG).
- Do not enjoy it (CYP, TG).
- Affordability particularly linked to gym membership (CYP, WOCBA and SA).
These reinforce the perception that physical activity is an add-on whereas it needs to be part of daily living.
Physical activity: What could commissioners and service planners consider?
- Make better use of the increasingly rich insight into sport and physical activity needs and aspirations of different groups, such as the Sport England segmentation, the evidence base for effective interventions. Also, actively involve target groups in designing and implementing interventions.
- Tailor messages to specific population groups to take account of their priorities and the specific barriers they face over their lifetime?
- Recognise that both moderate and vigorous intensity, sport and physical activity, have benefits, so people can combine different amounts and types of activity according to their lifestyle and preference.
- Enable people, particularly those groups most affected, to access the opportunities to increase physical activity levels that will best meet their needs, and make activity part of daily life.
- Incorporate opportunities to increase sport and physical activity in organisational plans and strategies where appropriate, such as those focusing on transport and the environment.
- Ensure an appropriate infrastructure is in place across Kirklees to deliver the range of sport and physical activity opportunities to meet the needs of the population now and in the future.
Physical activity: References
- Department of Health. Be Active Be Healthy (2009) – A plan to get the nation moving.
- Department of Health. Our Health and Wellbeing Today. 2010.
- Marmot, M. Fair Society, Healthy Lives: Strategic Review of Health Inequalities in England post 2010. 2010. http://www.marmot-review.org.uk/
- The NHS Information Centre. Health Survey for England (2008): Physical activity and fitness – Summary of the findings.
- The NHS Information Centre. Health Survey for England (2008) Trend tables
- NHS Kirklees, Kirklees Council and West Yorkshire Police. Young People’s Survey (YPS). 2009.
- NHS Kirklees and Kirklees Council. Current Living in Kirklees Survey (2012).
- Kirklees Partnership. Exploratory Research into the health of Women of Childbearing Age (2008) Prepared by 20/20 Research Ltd, Sheffield.
- Kirklees Council. Consultation with members of the Active Older People Network (2007 and 2009).
- Kirklees Council. Research into the attitudes of teenage girls to physical activity (2005). Prepared by RBA management Consultancy.
- Kirklees Council and NHS Kirklees. “Savile Town Women and Physical Activity” (2010) Prepared by DBA Management Consultancy Ltd.
- Kirklees Council. Survey with patients on the Practice Activity and Leisure Scheme (2008 and 2009).
- Sport England. Value of Sport Monitor.
- Sport England Local Sport Profile Tool – Update February 2012 http://archive.sportengland.org/research/local_sport_profiles.aspx
NB Data is from Active People 5 and includes data on moderate intensity physical activity for adults and also includes 5 light intensity activities for those aged 65 and over e.g. yoga, bowls, and archery. - Sport England segmentation tool http://segments.sportengland.org/
Market segmentation
Physical activity: Date this section was last reviewed
08/07/2013 (PL)