
 Air Quality
Headlines
Clean air is one of the most basic requirements of a healthy environment. Whilst air quality has improved over recent decades in the UK, there are still areas of the country where air pollution is having a significant effect on human health.
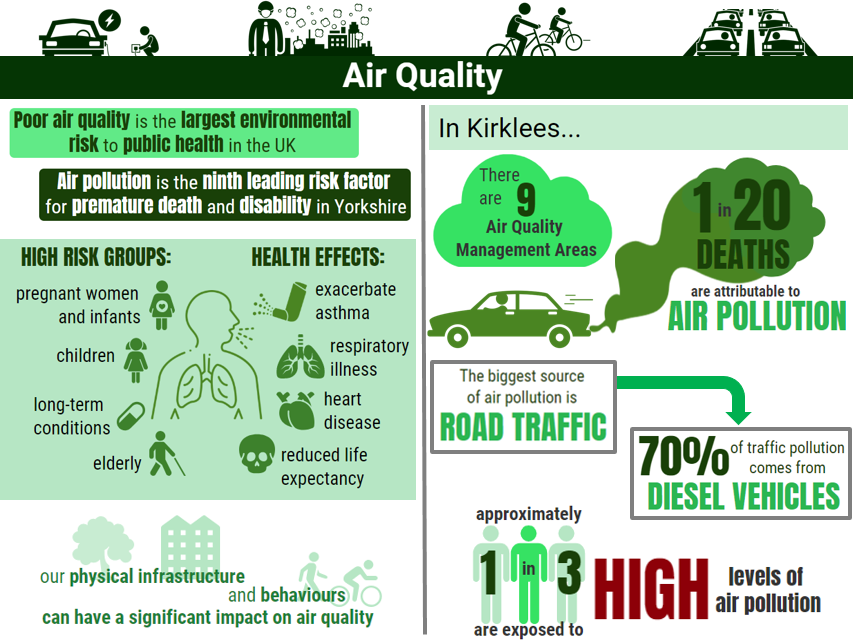
Exposure to high levels of air pollution has both short and long-term effects on health. Air pollution is the ninth leading risk factor for premature death and disability in both England and Yorkshire and Humber (1). This ranks air pollution above many other preventable mortality indicators, such as road deaths, excess winter deaths and communicable diseases.
Short-term exposure is associated with exacerbation of asthma, effects on lung function, increases in hospital admissions and reduced life expectancy. Long-term exposure to air pollution reduces life expectancy by increasing deaths from lung, heart and circulatory conditions. Whilst the short and long-term effects of air pollution are interrelated, at a population level the effects of long-term exposure to air pollution are much greater (2).
Our physical infrastructure and broader behaviours can also have an impact on air quality. Spatial planning, access to open and green space and the accessibility and confidence to walk and cycle all play a role in determining air quality.
What is in air pollution?
Outdoor air pollution has several components, including tiny particles of solids or liquids that are suspended in the air (particulate matter) and various gases. Pollutants may be emitted directly in to the air or produced through chemical reaction. There are a number of different air pollutants but the strongest evidence to date of the health effects relates to particulate matter (PM10 and PM2.5). Nitrogen dioxide (NO2) and other pollutants are also a concern (3).
Particulate matter (PM) is a complex mixture of very small solid particles and liquid droplets. The main source of PM is the combustion of fuels (vehicle, industry and domestic) and other human activities such as mining, quarrying, industrial processes and tyre and brake wear.
Nitrogen dioxide (NO2) is a gas that is produced with nitric oxide (NO) by combustion. Together they are often referred to as oxides of nitrogen (NOx).
Local road traffic contributes substantially to outdoor air pollution, particularly in busy towns and cities. Defra estimates that 80% of NOx emissions in areas where the UK is exceeding NO2 limits are due to transport, with the largest source being emissions from diesel light duty vehicles (cars and vans).
Why is this issue important?
Levels of outdoor air pollution have reduced significantly since the 1970s as a result of legislation and technological advances (4), however air pollution is still the biggest environmental health risk contributing to death in the UK (5) and has a significant impact on human health, particularly in our cities and towns.
Breathing polluted air has been linked to a range of health conditions including lower respiratory infections such as pneumonia, cardiovascular disease – including ischemic heart disease and stroke – some cancers and chronic respiratory diseases such as COPD (6). There is also emerging evidence that air pollution has a number of other adverse health effects including reduced lung function, and bladder cancer (7), low birth weight babies (8) and subsequent neurodevelopment problems in children.
If considering the impact of fine particulate matter alone, it is estimated that 29,000 deaths a year are attributable to human-made air pollution (9) – this rises to an estimated 40,000 attributable deaths if the effects of nitrogen dioxide are included (10).
It is important to understand that long-term exposure to air pollution is not thought to be the sole cause of deaths. Rather, it is considered to be a contributory factor. While air pollution is generally considered a contributory factor to mortality, there is evidence that outdoor air pollution causes lung cancer. Diesel engine exhaust, outdoor air pollution and particulate matter have all been classified by the World Health Organization as carcinogenic to humans (11).
Data on district wide levels of air pollutants for Kirklees is limited, but information is available at: http://www.kirklees.gov.uk/beta/crime-and-safety/air-pollution.aspx.
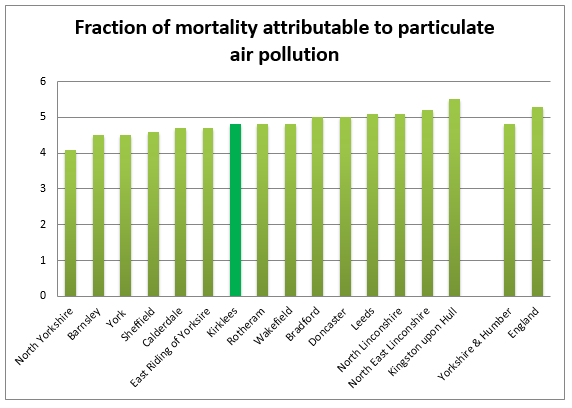
However, Public Health England provides modelled data on the health impacts of fine particulate matter (PM2.5) specifically. In 2016, it is estimated that 4.8% (1 in 20) of deaths in Kirklees were attributable to fine particulate matter. This compares to 4.8% of deaths in Yorkshire and Humber and 5.3% in England (12).
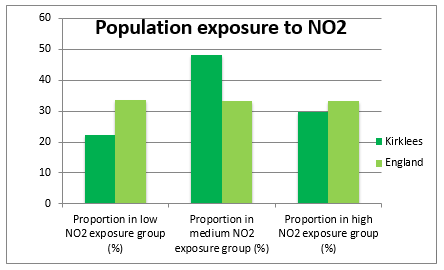
It is estimated that 22% of the Kirklees population are exposed to low NO2 levels compared to 34% across England, and 78% of the Kirklees population are exposed to medium or high levels of NO2 compared to 67% across England.
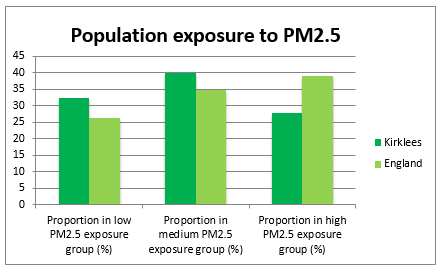
It is estimated that 32.34% of the Kirklees population are exposed to low PM2.5 levels compared to 26.31% across England, and 67.66% of the Kirklees population are exposed to medium or high levels of PM2.5 compared to 73.69% across England.
The Public Health England ‘tool to test the long term health and cost impacts of air pollution at a local authority level’ (13) can be used to project potential costs and disease prevalence attributable to outdoor air pollution at a local level, so that this may be factored into future policy and resource planning. The tool has the ability to quantify the potential costs to the NHS and social care due to the health impacts of Nitrogen Dioxide (NO2) and particulate matter (PM2.5). The costs include primary care, secondary care, medication use, social care, and the combination of all these costs. The tool allows local authorities to test different ‘what if’ scenarios for the reduction of air pollution or the local population’s exposure to air pollution. The tool can also estimate the rate of instances of certain diseases and deaths that could be avoided if air pollution exposure interventions are successful. The projections of the tool are based on estimated air pollution exposure levels in a population.
For example, the tools shows that the impact of 100% of the Kirklees population moving to low NO2 exposure would be:
- £1.86 million combined savings in associated costs for primary care, secondary care, social care and medication
- 113 prevalence cases per 100,000 of asthma are expected to be avoided by 2028
- 203 prevalence cases per 100,000 of diabetes are expected to be avoided by 2028
- 2 prevalence cases per 100,000 of lung cancer are expected to be avoided by 2028
And the impact of 100% of the Kirklees population moving to low PM2.5 exposure would be:
- £6.35 million combined savings in associated costs for primary care, secondary care, social care and medication
- 225 prevalence cases per 100,000 of coronary heart disease are expected to be avoided by 2028
- 125 prevalence cases per 100,000 of COPD are expected to be avoided by 2028
- 63 prevalence cases per 100,000 of stroke are expected to be avoided by 2028
- 242 prevalence cases per 100,000 of diabetes are expected to be avoided by 2028
- 6 prevalence cases per 100,000 of lung cancer are expected to be avoided by 2028
Assets
Health assets are those things that enhance the ability of individuals, communities and populations to maintain and sustain health and well-being. These include things like skills, capacity, knowledge, networks and connections, the effectiveness of groups and organisations and local physical and economic resources. They also include services or interventions that are already being provided or beginning to emerge which contribute to improved health and wellbeing outcomes.
Assets are hugely important to how we feel about ourselves, the strength of our social and community connections and how these shape our health and wellbeing. As part of our KJSA development we are piloting a range of methods to capture and understand the assets that are active in Kirklees. Please see the assets overview section for more information about our approach and if you are interested in place-based information about assets in Kirklees have a look at the assets section in each of our District Committee summaries (Batley and Spen, Dewsbury and Mirfield, Huddersfield and Kirklees Rural). Where possible and appropriate we will provide information about local assets supporting people across different stages of the life course.
In Kirklees, the following key projects will help to reduce the risk and impacts of air pollution:
West Yorkshire Low Emission Strategy (WYLES) – sets a joint strategic direction for reducing emissions across the region through a number of shared priorities
Development of Kirklees Air Quality Action Plan – working partnership to develop a range local policy and actions to improve air quality across the District
These will include measures such as:
Retro-fitting Exhaust Emission Reduction Technology on Buses – which will clean up the vehicle’s emissions by removing pollutants
Rationalisation of Traffic Lights System – using smart technology to improve the flow of heavy emission vehicles at traffic lights
ECOStars – recognises and shares good practice for encouraging low emissions in the freight industry
Measures to increase the uptake of Electric Vehicles such as implementing the Electric Taxi Charge Point Scheme in West Yorkshire
Implementation of the Walking and Cycling Strategic Framework, including a walking and cycling action plan. The vision of the strategy is that Kirklees is recognised as a great place to walk and cycle, inspiring more people to walk and cycle more often as a mode of transport, for work, leisure or for sport.
A range of cycling and walking groups and activities are available for Kirklees residents.
A full list of improvement projects undertaken by the council to reduce air quality is contained within the Council Annual Status Report and is available on the website at:
http://www.kirklees.gov.uk/beta/crime-and-safety/air-pollution.aspx
What significant factors are affecting this issue?
Outdoor air contains a range of pollutants, both natural and human-made. Human-made pollutants come from a range of different sources including industrial processes, farming, heating our homes and generating energy. However, the single biggest source of air pollution in urban areas – where most of the population live – is road transport, specifically diesel vehicles.
UK legislation imposes statutory ceiling limits for major pollutants, including: sulphur dioxide, nitrogen oxides, Particulate Matter (PM2.5 and PM10), ammonia and volatile organic compounds. The limits for nitrogen dioxide are not being met in all areas of the UK with the main challenge in meeting the limits being alongside busy roads in cities and towns (14).
Half of nitrogen dioxide emissions in the UK come from cars. On average approximately 80% of nitrogen oxide (NO2) emissions in areas where the UK is exceeding NO2 limit values are due to transport. The main source of NO2 emissions is diesel light duty vehicles (cars and vans) and there has been significant growth in these vehicle numbers over the last decade (15).
There are more diesel vehicles in Europe than the rest of the world (16). The shift towards diesel in Europe was a strategic decision that was made to help address climate change. This was based on evidence that diesel vehicles emit less carbon dioxide than petrol vehicles and at the time, there was less evidence on the direct impact of diesel emissions on human health.
Urban concentrations of NO2 have not improved as rapidly had been anticipated. This is due to a combination of the increased number of diesel vehicles on the roads and technological challenges in reducing their real-world emissions which have been shown to be many times higher on the roads than in laboratory tests (17).
Whilst over time the ongoing move to ultra-low emission vehicles is expected to reduce nitrogen dioxide levels, the Government’s ‘UK plan for tackling roadside nitrogen dioxide emissions’ (18) published in 2017 sets out plans to do this sooner. A broader Clean Air Strategy will follow in 2019 which should cover a wider range of pollutants.
It is also important to highlight the impact which our physical infrastructure and broader behaviours can have on air quality. The link between planning and health has been long established. The built and natural environments are major determinants of health and wellbeing (19). The Kirklees Publication Draft Local Plan, which sets out new developments in the district, recognises that essential travel needs can be met by forms of sustainable transport other than the private car. The council will support development proposals that can be served by alternative modes of transport such as public transport, cycling and walking (20). How we travel can have a significant impact on air quality. The more people who walk, cycle or use public transport for their journeys, the greater the impact on improving air quality.
Local authority duties
The policy context relating to air pollution and the duties of the Local Authority are outlined here: https://uk-air.defra.gov.uk/air-pollution/uk-eu-policy-context
Where is this causing greatest concern?
Poor air quality affects everyone but the health effects of air pollution are distributed unequally across the population. In general, levels of air pollution tend to be worse in more deprived communities because they are more likely to be close to busy polluted roads. Analysis by the Environment Agency into environmental quality and social deprivation looked at the social distribution of wards with the highest pollutant concentrations. This found that more than half of the most exposed 5% of the population lived in the 20% most deprived wards.
Children, older people, and people with chronic health problems are most at risk of the effects of air pollution (21). Where these groups live in more deprived communities located close to busy roads, the risk of health problems caused by exposure to air pollution will be further increased.
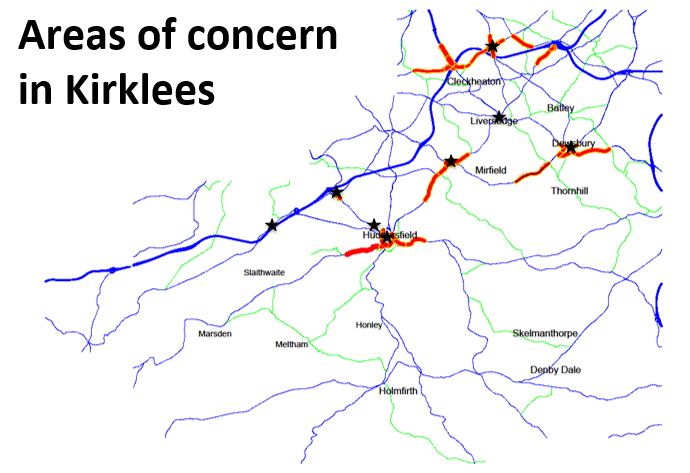
In Kirklees, certain geographical areas are of concern due to high levels of air pollution:
Air Quality Management Areas (22)
The Department for Environment, Food and Rural Affairs state that since December 1997 each local authority in the UK has been carrying out reviews and assessments of air quality in their area. This involves measuring air pollution and trying to predict how it will change in the next few years. The purpose of these reviews and assessments is to make sure that the national air quality objective will be achieved throughout the UK by the relevant deadlines.
If a local authority identifies any places where the objectives are not likely to be achieved, it must declare an Air Quality Management Area. This area could be just one or two streets or it could be much bigger.
The local authority will then put together a plan to improve the air quality in this area – a Local Air Quality Action Plan.
In Kirklees, there are currently nine Air Quality Management Areas – Ainley Top, Bradley, Birkenshaw, Eastborough, Edgerton, Huddersfield Town Centre, Liversedge, Outlane, and Thornton Lodge.
Previously there was also an AQMA at Scout Hill, but due to positive interventions and resulting improved air quality in the area the AQMA status has now been removed.
For up to date information on AQMAs in Kirklees see http://www.kirklees.gov.uk/beta/crime-and-safety/air-pollution.aspx.
What could commissioners and service planners consider?
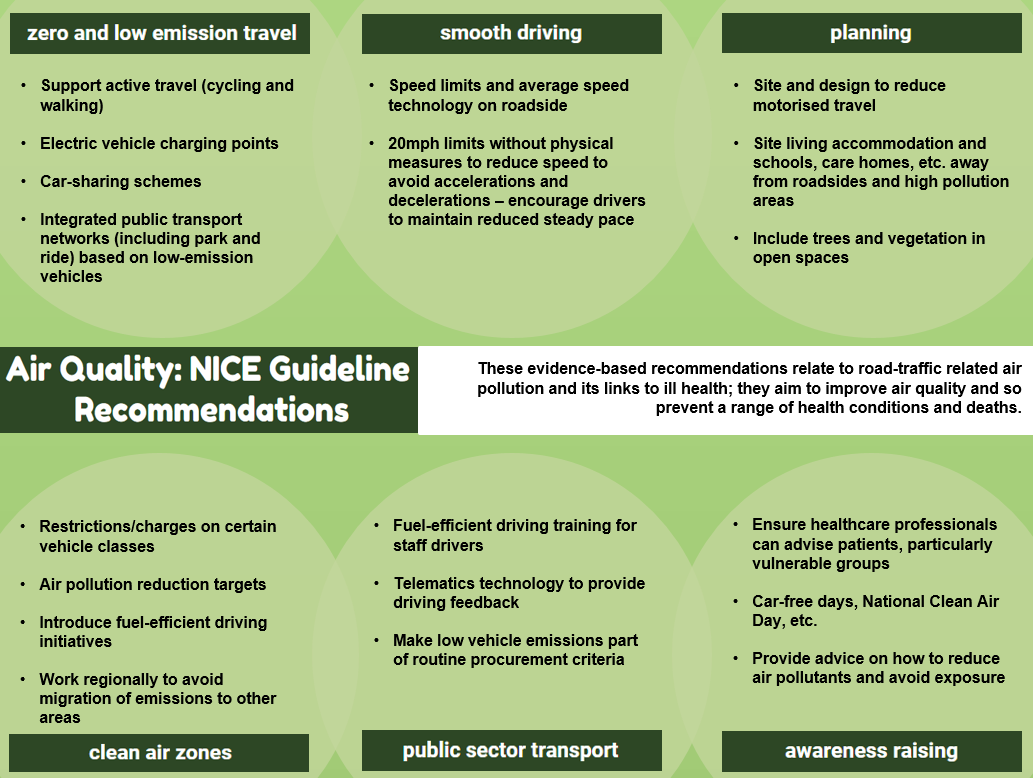
- Update the Kirklees Air Quality Action Strategy and Action Plan ensuring cross-Council action and alignment with evidence-based NICE Guideline 70 on outdoor air quality, delivering actions such as:
- Moving towards an Ultra-Low Emission Vehicle Fleet
- Continuing to improve the Cycling & Walking Network e.g. via the Highways Supplementary Planning Guidance
- To work to understand the barriers to walking and cycling in order to increase walking and cycling levels
- Further integrate WYLES Planning
- Raise awareness of air pollution & health impacts (e.g. public awareness campaigns promoting how individuals can reduce their personal emissions and avoid exposure, such as Clean Air Day, Cycle to Work Day, Bike Week, etc., and raising awareness of the impact of air pollution amongst health professionals, particularly those who come into contact with vulnerable groups)
- Work regionally to promote alternative transport for commuters
- Work regionally to promote emissions reduction in the freight sector
- Work with public transport providers to improve service and vehicles
- Continue to develop partnerships with local anchor institutions in order to share best practice around improving air quality across Kirklees
References
1) Institute for Health Metrics and Evaluation, Country profiles. Accessed at: http://www.healthdata.org/united-kingdom-england-yorkshire-and-humber
2) World Health Organisation, “Review of the evidence on health aspects of air pollution”, REVIHAPP Project, 2013. Accessed at: http://www.euro.who.int/__data/assets/pdf_file/0004/193108/REVIHAAP-Final-technical-report-final-version.pdf?ua=1
3) DEFRA, Public Health England and Local Government Association, “Air Quality: a briefing for Directors of Public Health”, 2017. Accessed at: https://www.local.gov.uk/air-quality-briefing-directors-public-health
4) DEFRA, “Emissions of air pollutants in the UK, 1970 to 2015”, 2016. Accessed at: https://webarchive.nationalarchives.gov.uk/ukgwa/20180104122231/https://www.gov.uk/government/statistics/emissions-of-air-pollutants
5) Public Health England, “Estimating Local Mortality Burdens associated with Particulate Air Pollution”, 2014. Accessed at: https://www.gov.uk/government/uploads/system/uploads/attachment_data/file/332854/PHE_CRCE_010.pdf
6) Royal College of Physicians, “Every breath we take: the lifelong impact of air pollution”, 2016. Accessed at: https://www.rcplondon.ac.uk/projects/outputs/every-breath-we-take-lifelong-impact-air-pollution
7) World Health Organisation, International Agency for Research on Cancer, June 2012. Accessed at: https://www.iarc.fr/en/media-centre/pr/2012/pdfs/pr213_E.pdf
8) Penderson, M. et al, “Ambient air pollution and low birthweight: a European cohort study (ESCAPE)”, The Lancet, October 2013. Accessed at: https://www.thelancet.com/journals/lanres/article/PIIS2213-2600(13)70192-9/abstract
9) World Health Organisation, 2013.
10) DEFRA and DfT, “UK plan for tackling roadside nitrogen dioxde concentrations”, 2017. Accessed at: https://www.gov.uk/government/uploads/system/uploads/attachment_data/file/633269/air-quality-plan-overview.pdf
11) Public Health England, “Understanding the Impact of Particulate Air Pollution”, 2015. Accessed at: https://publichealthmatters.blog.gov.uk/2015/11/03/understanding-the-impact-of-particulate-air-pollution/
12) Public Health Outcomes Framework. Accessed at: https://fingertips.phe.org.uk/profile/public-health-outcomes-framework/data#page/3/gid/1000043/pat/6/par/E12000003/ati/102/are/E08000034/iid/30101/age/230/sex/4
13) Public Health England, “Air Pollution: a tool to estimate healthcare costs”, 2018. Accessed at: https://www.gov.uk/government/publications/air-pollution-a-tool-to-estimate-healthcare-costs
14) DEFRA and DfT, 2017.
15) DEFRA, PHE and LGA, 2017.
16) Royal College of Physicians, 2016.
17) DEFRA and DfT, 2017.
18) DEFRA and DfT, 2017.
19) Ministry of Housing, Communities & Local Government, “Guidance: The role of health and wellbeing in planning”, 2017. Accessed at: https://www.gov.uk/guidance/health-and-wellbeing
20) Kirklees Council, Local Plan. Accessed at: http://www.kirklees.gov.uk/beta/planning-policy/pdf/submission-documents/SD1_Kirklees_Publication_Draft_Local_Plan-Strategy_and_Policies.pdf
21) Royal College of Physicians, 2016.
Date this section was last reviewed
Decemeber 2018 (LW/RC)