1. Who lives in Kirklees?
1.1 Total population
According to the Office for National Statistics (ONS), the estimated 2023 mid-year population for Kirklees was 442,033 people. This is an increase of 8,811 over the 2021 census figure (433,222) and an increase of 19,575 over the 2011 census figure (422,458).
See section 4 below (‘How is the population changing?’) for more information on population trends in Kirklees.
1.2 Protected characteristic groups
The Equality Act 2010 was created to consolidate current legislation around discrimination. The Act defines nine protected population characteristics that must be considered when striving for equality. All figures below are taken from the 2021 national census, unless otherwise indicated.
1.2.1 Age
According to ONS mid-year estimates for 2023, 19.8% of the Kirklees population (87,501 people) are under 16 years of age; 62.2% (274,751 people) are between 16 and 64 years of age; 18.0% (79,781 people) are over 64 years old. Kirklees has a higher proportion of younger people, and a lower proportion of older people, compared with Yorkshire and the Humber and with England.
A more detailed age breakdown for Kirklees is as follows:
- 24,810 aged 4 years and under (5.6%)
- 27,493 aged 5 to 9 years (6.2%)
- 29,340 aged 10 to 14 years (6.6%)
- 27,731 aged 15 to 19 years (6.3%)
- 25,995 aged 20 to 24 years (5.9%)
- 56,159 aged 25 to 34 years (12.7%)
- 85,209 aged 35 to 49 years (19.3%)
- 85,515 aged 50 to 64 years (19.3%)
- 41,618 aged 65 to 74 years (9.4%)
- 28,187 aged 75 to 84 years (6.4%)
- 9,976 aged 85 years and over (2.3%)
Figure 1: Population pyramids for Kirklees (bars) and England (lines (2023 mid-year estimates)
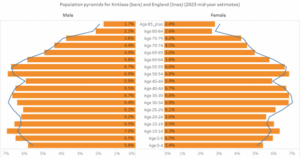
Source: Office for National Statistics
1.2.2 Disability
Census data shows 75,591 people in Kirklees are classed as disabled under the Equality Act (defined in the census as day-to-day activities limited a little or a lot) – this is 17.4% of the total population.
1.2.3 Gender identity
According to the census, out of 346,275 residents aged 16 and over:
- 21,214 chose not to answer the question on gender identity
- 323,432 identified as the same gender as their sex registered at birth (99.5% of those answering the question)
- 1,629 identified as a different gender to their sex registered at birth (0.5%). Of these:
- 304 identified as a trans woman (0.1%)
- 316 identified as a trans man (0.1%)
- 161 identified as non-binary (0.0%)
- 96 identified as another gender identity (0.0%)
- 752 identified as a different gender to their sex registered at birth, but did not give a specific identity (0.2%)
1.2.4 Marriage and civil partnership
According to the census, out of 346,274 residents aged 16 and over:
- 125,290 have never married and never registered a civil partnership (36.2%)
- 159,426 are married or in a registered civil partnership (46.0%). Of these:
- 158,886 are married (45.9%)
- 540 are in a registered civil partnership (0.2%)
- 8,027 are separated, but still legally married or still legally in a civil partnership (2.3%)
- 32,022 are divorced or have had a civil partnership dissolved (9.2%)
- 21,509 are widowed or are a surviving civil partnership partner (6.2%)
1.2.5 Pregnancy and maternity
According to ONS civil registration data, there were 4,374 live births in Kirklees in 2023. This figure is lower than the number of live births in 2022 (4,702).
In Kirklees there were 16 stillbirths in 2023, giving a rate of 3.6 stillbirths per 1,000 live births and stillbirths. This stillbirth rate is similar to the figures for Yorkshire and the Humber (3.7) and England (3.9). A higher number of stillbirths (19) in 2022 gave a higher Kirklees rate (4.0 stillbirths per 1,000 live births and stillbirths), which was similar to the rates for Yorkshire and the Humber (4.0) and England (3.9).
Mothers in Kirklees tend to be younger than the national average. In 2023, 46.1% of Kirklees mothers were aged under 30 (2.7% aged under 20 and 43.4% aged 20-29) and 53.9% aged 30 plus (49.3% aged 30-39 and 4.6% aged 40 plus). This compares to the England average of 39.6% aged under 30 and 60.4% aged 30 plus.
Further information on births in Kirklees can be found in section 4 (‘How is the population changing?’) below, and in the ‘Starting Well’ section of the KJSA.
1.2.6 Race/ethnicity
The 2021 census gives the following breakdown of population by broad ethnic group:
- 84,202 Asian (including Asian British/Asian Welsh) (19.4%)
- 9,948 Black (including Black British/Black Welsh, Caribbean or African) (2.3%)
- 13,588 Mixed or multiple ethnic groups (3.1%)
- 318,969 White (73.6%)
- 6,506 Other ethnic group (1.5%)
There are at least 500 Kirklees residents in the following detailed ethnic categories:
Table 1: Population counts by ethnicity, 2021 Census
| Category | Number | % |
| Asian, Asian British or Asian Welsh: Bangladeshi, British Bangladeshi | 1,065 | 0.2 |
| Asian, Asian British or Asian Welsh: Chinese | 1,526 | 0.4 |
| Asian, Asian British or Asian Welsh: Indian or British Indian | 22,739 | 5.2 |
| Asian, Asian British or Asian Welsh: Kashmiri | 991 | 0.2 |
| Asian, Asian British or Asian Welsh: Pakistani or British Pakistani | 54,795 | 12.6 |
| Black, Black British, Black Welsh of African background: African unspecified | 2,019 | 0.5 |
| Black, Black British, Black Welsh of African background: Nigerian | 884 | 0.2 |
| Black, Black British, Black Welsh or Caribbean background: Black British | 1,029 | 0.2 |
| Black, Black British, Black Welsh or Caribbean background: Caribbean | 4,318 | 1.0 |
| Mixed or Multiple ethnic groups: Other Mixed | 553 | 0.1 |
| Mixed or Multiple ethnic groups: White and Asian (unspecified) | 3,980 | 0.9 |
| Mixed or Multiple ethnic groups: White and Black African | 1,035 | 0.2 |
| Mixed or Multiple ethnic groups: White and Black Caribbean | 6,433 | 1.5 |
| White: English, Welsh, Scottish, Northern Irish or British | 305,576 | 70.5 |
| White: European Mixed | 1,793 | 0.4 |
| White: Irish | 2,335 | 0.5 |
| White: Other White, White unspecified | 537 | 0.1 |
| White: Polish | 3,485 | 0.8 |
| White: Romanian | 792 | 0.2 |
| Other ethnic group: Arab | 1,915 | 0.4 |
| Other ethnic group: Kurdish | 1,267 | 0.3 |
| Other ethnic group: Sikh | 565 | 0.1 |
Source: Office for National Statistics, 2021 Census
The census gives the following breakdown of the Kirklees population by country/continent of birth:
- 378,708 born in the United Kingdom (87.4%)
- 1,547 born in EU member countries (members in March 2001 plus Ireland, excluding UK) (0.4%)
- 12,242 born in other European countries (excluding Ireland) (2.8%)
- 5,588 born in Africa (1.3%)
- 31,852 born in the Middle East and Asia (7.4%)
- 2,790 born in The Americas and the Caribbean (0.6%)
- 490 born in another continent (0.1%)
1.2.7 Religion and belief
23,949 people did not answer the census question on religion. Of those answering the question:
- 170,577 Christian (41.7% of those answering the question)
- 150,599 No religion (36.8%)
- 80,046 Muslim (19.6%)
- 3,476 Sikh (0.8%)
- 1,723 Hindu (0.4%)
- 996 Buddhist (0.2%)
- 187 Jewish (0.0%)
- 1,663 Other religion (0.4%)
1.2.8 Sex
According to the census, Kirklees has slightly more females (51.0%) than males (49.0%).
1.2.9 Sexual orientation
25,742 people did not answer the census question on sexual orientation. Of those residents aged 16 and over answering the question:
- 311,501 Straight or Heterosexual (97.2% of those answering the question)
- 9,035 Not Straight/Heterosexual (2.8%). This includes:
- 4,340 Gay or Lesbian (1.4%)
- 3,697 Bisexual (1.2%)
- 732 Pansexual (0.2%)
- 147 Asexual (0.0%)
- 58 Queer (0.0%)
- 61 All other sexual orientations (0.0%)
1.3 Other population characteristics
1.3.1 Veterans
For residents aged 16 years and over, the census shows:
- 334,484 have not previously served in any UK armed forces (96.6%)
- 8,942 have previously served in UK regular armed forces (2.6%)
- 2,371 have previously served in UK reserve armed forces (0.7%)
- 478 have previously served in both regular and reserve UK armed forces (0.1%)
1.3.2 Language
Of 177,988 households in Kirklees, the census shows there are:
- 160,454 households where all adults in the household have English as a main language (90.1%)
- 9,297 households where at least one (but not all) adults in the household have English as a main language (5.2%)
- 1,887 households where no adults in the household, but at least one person aged 3 to 15 years, has English as a main language (1.1%)
- 6,350 households where no-one in the household has English as a main language (3.6%)
1.3.3 Length of residence in UK
Figures from the census for all Kirklees residents by length of residence in the UK show:
- 378,708 were born in the UK (87.4%)
- 36,566 have been resident in the UK for 10 years or more (8.4%)
- 7,218 have been resident in the UK for 5 years or more, but less than 10 years (1.7%)
- 5,308 have been resident in the UK for 2 years or more, but less than 5 years (1.2%)
- 5,416 have been resident in the UK for less than 2 years (1.3%)
Further population characteristics can be found on the Kirklees Observatory:
https://observatory.kirklees.gov.uk/population
2. Where do people live?
2.1 Ward distribution
According to ONS mid-year estimates for 2022, the average population for Kirklees Wards is 19,026. Two wards have population counts above 21,000: Greenhead (22,439) and Dewsbury West (21,571). Two wards have population counts below 17,000: Kirkburton (16,393) and Denby Dale (16,724).
Figure 2: Map of population by ward (2022 mid-year estimates)
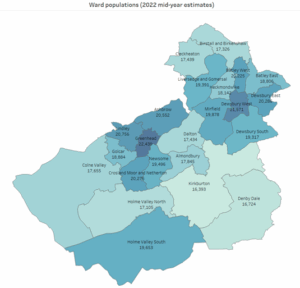
Source: Office for National Statistics
2.2 Deprivation
The Kirklees population estimates at Lower Super Output Area level can be matched to the 2019 Index of Multiple Deprivation (IMD) to show the number of people in each deprivation decile. IMD is a relative measure of deprivation for England; those in the most deprived decile live in areas defined as being amongst the 10% most deprived areas in England.
Based on ONS mid-year estimates for 2022, the Kirklees distribution by IMD decile is as follows:
- 56,863 people live in the most deprived 10 percent (13.0%)
- 78,537 people live in the most deprived 10 to 20 percent (17.9%)
- 57,008 people live in the most deprived 20 to 30 percent (13.0%)
- 37,843 people live in the most deprived 30 to 40 percent (8.6%)
- 42,108 people live in the most deprived 40 to 50 percent (9.6%)
- 33,571 people live in the least deprived 50 to 60 percent (7.7%)
- 34,100 people live in the least deprived 60 to 70 percent (7.8%)
- 51,852 people live in the least deprived 70 to 80 percent (11.8%)
- 30,572 people live in the least deprived 80 to 90 percent (7.0%)
- 15,340 people live in the least deprived 90 to 100 percent (3.5%)
Figure 3: Kirklees population by IMD decile (2022 mid-year estimates)
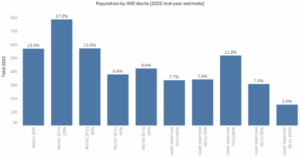
Source: Office for National Statistics
The Office for National Statistics also uses census data to calculate number of households by deprivation dimensions, based on the following four household characteristics:
- Education dimension: A household is classified as deprived if no one has at least level 2 education and no one aged 16 to 18 years is a full-time student.
- Employment dimension: A household is classified as deprived if any member, not a full-time student, is either unemployed or economically inactive due to long-term sickness or disability.
- Health dimension: A household is classified as deprived if any person in the household has general health that is bad or very bad or is identified as disabled. People who have assessed their day-to-day activities as limited by long-term physical or mental health conditions or illnesses are considered disabled. This definition of a disabled person meets the harmonised standard for measuring disability and is in line with the Equality Act (2010).
- Housing dimension: A household is classified as deprived if the household’s accommodation is either overcrowded, in a shared dwelling, or has no central heating.
Based on a total of 177,990 households, Kirklees has the following breakdown by deprivation dimension:
- 82,995 households are not deprived in any dimension (46.6%)
- 59,593 households are deprived in one dimension (33.5%)
- 27,052 households are deprived in two dimensions (15.2%)
- 7,881 households are deprived in three dimensions (4.4%)
- 469 households are deprived in four dimensions (0.3%)
These percentage breakdowns by deprivation dimension in Kirklees are similar to those for Yorkshire & The Humber. However, Kirklees has a higher proportion of households deprived in two or more dimensions, and a lower proportion of non-deprived households, compared with the England average.
Further information on deprivation can be found in the ‘Inequalities’ section of the KJSA.
2.3 Tenancy
According to the census, of 177,989 households in Kirklees:
- 62,352 households own their property outright (35.0%)
- 54,932 households own their property with a mortgage or loan or shared ownership (30.9%)
- 26,288 households are in social rented properties (14.8%)
- 34,417 households are in private rented properties or live rent free (19.3%)
Further place-based reports can be found on the Kirklees Observatory:
https://observatory.kirklees.gov.uk/overview-reports
Maps of 2021 census data can be generated using the Office for National Statistics tool here:
https://www.ons.gov.uk/census/maps?lad=E08000034
3. What do people do?
3.1 Qualification level
For residents aged 16 years and over, the census shows the following highest levels of qualification:
- 71,832 have no qualifications (20.7%)
- 33,776 have Level 1 and entry level qualifications (9.8%)
- 231,486 are qualified to Level 2 or above (inc. Apprenticeships) (66.9%). This includes:
- 46,112 with Level 2 qualifications (13.3%)
- 21,655 with Apprenticeship (6.3%)
- 60,187 with Level 3 qualifications (17.4%)
- 103,532 with Level 4 qualifications or above (29.9%)
- 9,180 have other qualifications (2.7%)
A full definition of qualifications by level can be found here:
https://www.gov.uk/what-different-qualification-levels-mean/list-of-qualification-levels
3.2 Economic activity
According to the census, for residents aged 16 years and over:
- 194,117 are economically active (excluding full-time students) (56.1%). This includes:
- 184,331 who are in employment (53.2%)
- 9,786 who are unemployed (2.8%)
- 8,073 are economically active and a full-time student (2.3%). This includes:
- 5,753 who are in employment (1.7%)
- 2,320 who are unemployed (0.7%)
- 144,081 are economically inactive (41.6%). This includes:
- 75,708 who are retired (21.9%)
- 20,161 who are students (5.8%)
- 20,051 who are looking after the home or family (5.8%)
- 16,284 who are long-term sick or disabled (4.7%)
- 11,877 who fall into another category (3.4%)
3.3 Carers
Of the 408,074 Kirklees residents aged 5 years and over, the census shows:
- 371,038 provide no unpaid care (90.9%)
- 370,36 provide any unpaid care (9.1%)
- 185,19 provide 19 or less hours unpaid care a week (4.5%)
- 7,808 provide 20 to 49 hours unpaid care a week (1.9%)
- 10,709 provide 50 or more hours unpaid care a week (2.6%)
3.4 Volunteering
According to the 2021 Current Living in Kirklees (CLiK) survey, a quarter (25%) of residents aged 16+ had taken part in volunteering in the past 12 months, including 14% who volunteered at least once a month.
Further information on local employment and the economy can be found on the Kirklees Observatory:
https://observatory.kirklees.gov.uk/economy-and-employment
4. How is the population changing?
The three drivers of population change are births, deaths, and migration (people moving into or out of the area).
4.1 Population trends over time
According to the ONS mid-year population estimates, the Kirklees population has increased by 19,063 people between 2011 and 2023 (a 4.5% increase, from 422,970 to 442,033). Over this period, the population aged 0 to 15 has increased by 1.5% (1,279 people), the population aged 16 to 64 has increased by 1.0% (2,744 people), and the population aged 65 and over has increased by 23.2% (15,040 people). Both the 0 to 15 and 16 to 64 age groups have reduced as a proportion of the total population, while the 65+ age group has increased.
Figure 4: Kirklees mid-year population estimates by age group, 2011 to 2023

Source: Office for National Statistics
4.1.1 Components of change: 2022-23
ONS figures show that between 2022 and 2023, the Kirklees population increased by 4,239 (1%). The natural change in population (difference between births and deaths) was 246; net internal migration was -1,167 (16,344 internal in-migrants and 17,511 internal out-migrants); net international migration was 5,177 (7,496 international in-migrants and 2,319 international out-migrants).
4.2 Births
According to ONS civil registration data, there were 4,374 live births in Kirklees in 2023, a decrease of 328 on 2022 (-7.0%). This data shows a downward trend in Kirklees births over the last 10 years, from 5,472 births in 2014 (a 20.1% decrease on the 2014 figure in 2023).
Figure 5: Kirklees live births by year, 2014 to 2023
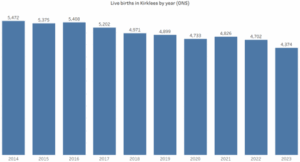
Source: Office for National Statistics
The Total Fertility Rate (TFR) for Kirklees in 2023 was 1.52. TFR is the average number of live children that a group of women would bear if they experienced the age-specific fertility rates of the calendar year throughout their childbearing lifespan. The Kirklees TFR figure is higher than the averages for Yorkshire and the Humber (1.47) and England (1.44).
The General Fertility Rate (GFR, number of live births per 1,000 female population aged 15 to 44) for Kirklees in 2023 was 51.1, which is higher than the averages for Yorkshire and the Humber (50.1) and England (49.9).
The data shows a downward trend for both the TFR and GFR over the last 10 years in Kirklees; the TFR and GFR were 22.1% and 21.4% lower, respectively, in 2023 compared to 2014. This is in line with regional and national trends, where equivalent TFR and GFR comparisons for Yorkshire and the Humber show decreases of 20.1% and 18.7%, respectively, and for England show decreases of 20.0% and 18.9%, respectively.
At Ward level, Dewsbury West had the largest number of live births in 2023 (332 live births, 7.6% of all Kirklees live births in 2023); Holme Valley South had the smallest number (103 live births, 2.4% of all Kirklees live births). Comparing Ward-level births in 2023 with 2014, only one Ward, Holme Valley North, saw an increase (+2.6%, from 151 live births in 2014 to 155 in 2023); the largest decreases were seen in Liversedge and Gomersal (-35.3%) and Ashbrow (-30.9%).
Figure 6: Map of live births by ward, 2023
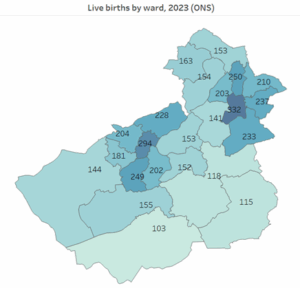
Source: Office for National Statistics
Local maternity data provided by the two main NHS Hospital Trusts in Kirklees (Calderdale and Huddersfield NHS Foundation Trust and Mid Yorkshire Teaching NHS Trust) shows the following for live births in Kirklees in 2023:
- The majority of births were to women aged 25-34 (62.4% of live births, where age is known), followed by ages 35-44 (20.6%) and 18-24 (15.9%). Around 1% of births were to women who were either under 18 (0.8%) or over 44 (0.3%).
Figure 7: Kirklees births by age of mother, 2023
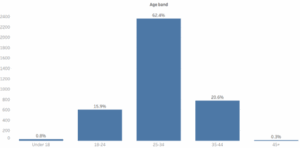
Source: Maternity data from Calderdale and Huddersfield NHS Foundation Trust and Mid Yorkshire Teaching NHS Trust
- Almost half of live births (44.2%) were to women living in areas categorised as amongst the most deprived 20% in England. In contrast, 4.5% of live births were to women living in areas categorised as amongst the least deprived 20% in England.
Figure 8: Kirklees births by deprivation quintile, 2023
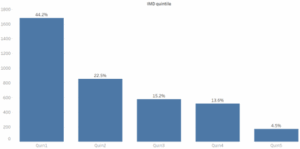
Source: Maternity data from Calderdale and Huddersfield NHS Foundation Trust and Mid Yorkshire Teaching NHS Trust
- Half of births were to women of White British ethnicity (50.3%), with a quarter of births to women of Pakistani ethnicity (25.3%). The next highest proportions were Indian ethnicity (6.1%) and other White ethnicities (excluding Irish) (4.1%).
Figure 9: Kirklees births by ethnicity of mother, 2023

Source: Maternity data from Calderdale and Huddersfield NHS Foundation Trust and Mid Yorkshire Teaching NHS Trust
4.3 Deaths
4.3.1 Overall and excess deaths
In 2023 there were 4,277 registered deaths for Kirklees residents. This is similar to the figures for 2022 (4,224) and 2021 (4,226) and lower than the figure for 2020 (4,572). In general, numbers of registered deaths have been on an upward trend since 2010. However, higher mortality rates since 2020 have been influenced by COVID-19. In 2020, 642 registered deaths recorded COVID-19 as the underlying cause of death; in 2021, there were 381 COVID-19 deaths, in 2022, there were 152, and in 2023, there were 78.
Figure 10: Kirklees deaths by year
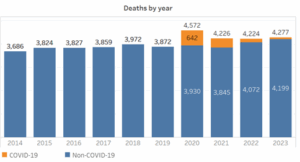
Source: Office for National Statistics, death registration data
Comparing total registered deaths between 2020 and 2023 with the previous five-year average (2015-19), there were 701 excess deaths in 2020, 355 excess deaths in 2021, 353 excess deaths in 2022, and 406 excess deaths in 2023. COVID-19 accounts for the majority of excess deaths in 2020, for all the excess deaths in 2021, and for just under half of excess deaths in 2022.
In 2024, the Office for Health Improvement and Disparities changed its methodology for calculating excess mortality (Changes to OHID’s reporting of excess mortality in England – GOV.UK (www.gov.uk)). Using this method, OHID has calculated there were 92 excess deaths for Kirklees in 2023.
4.3.2 Deaths by underlying cause
For deaths registered in 2023, the most common underlying causes of death based on ICD-10 (International Classification of Disease, 10th revision, version 2019) chapters were:
- Diseases of the circulatory system: 1,141 (26.7%)
- Malignant neoplasms: 1,039 (24.3%)
- Diseases of the respiratory system: 521 (12.2%)
- Mental and behavioural disorders: 294 (6.9%)
- Diseases of the nervous system: 291 (6.8%)
- Diseases of the digestive system: 224 (5.2%)
For the above categories, the following underlying cause sub-categories (three-character ICD-10 codes) had at least 50 registered deaths in 2023.
Diseases of the circulatory system:
- Chronic ischaemic heart disease: 331 (29.0% of deaths in this category)
- Acute myocardial infarction: 174 (15.2%)
- Stroke, not specified as haemorrhage or infarction: 93 (8.2%)
- Atrial fibrillation and flutter: 67 (5.9%)
- Hypertensive heart disease: 53 (4.6%)
- Heart failure: 50 (4.4%)
Malignant neoplasms:
- Malignant neoplasm of bronchus and lung: 215 (20.7% of deaths in this category)
- Malignant neoplasm of prostate: 78 (7.5%)
- Malignant neoplasm of breast: 74 (7.1%)
- Malignant neoplasm, without specification of site: 63 (6.1%)
- Malignant neoplasm of colon: 60 (5.8%)
- Malignant neoplasm of pancreas: 53 (5.1%)
Diseases of the respiratory system:
- Other chronic obstructive pulmonary disease: 199 (38.2% of deaths in this category)
- Pneumonia, organism unspecified: 165 (31.7%)
- Other interstitial pulmonary diseases: 59 (11.3%)
Mental and behavioural disorders:
- Unspecified dementia: 231 (78.6% of deaths in this category)
- Vascular dementia: 48 (16.3%)
Diseases of the nervous system:
- Alzheimer disease: 177 (60.8% of deaths in this category)
- Parkinson disease: 50 (17.2%)
Diseases of the digestive system:
- Alcoholic liver disease: 54 (24.1%)
Other underlying cause sub-categories (three-character ICD-10 codes) with at least 50 registered deaths in 2023, not covered by categories above:
- Emergency use of code U07: 78 (all these deaths relate to COVID-19)
- Senility (code R54): 90
- Other general symptoms and signs (code R68): 54
- Unspecified fall (code W19): 52
4.3.3 Deaths by age
Over half of deaths registered in 2023 were for people aged 80+ (2,228 deaths, 52.1%), and three quarters were for people aged 70+ (3,208 deaths, 75.0%). This equates to 111 deaths per 1,000 population in the 80+ age group.
Figure 11: Kirklees registered deaths by age group, 2023

Source: Office for National Statistics, death registration data
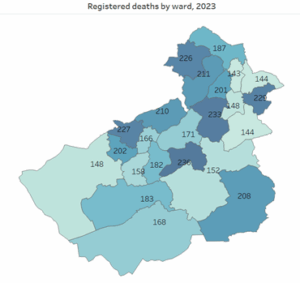
4.3.4 Deaths by Ward
At Ward level, Almondbury had the highest number of registered deaths in 2023 (236 deaths, 5.5% of all deaths), followed by Mirfield (233, 5.4%), Dewsbury East (229, 5.4%), Lindley (227, 5.3%) and Cleckheaton (226, 5.3%). Batley West registered the fewest deaths (143, 3.3%), followed by Dewsbury South (144, 3.4%) and Batley East (144, 3.4%).
Figure 12: Map of registered deaths by ward, 2023
Source: Office for National Statistics, death registration data
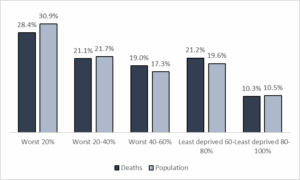
4.3.5 Deaths by deprivation decile
Numbers of registered deaths in 2023 by IMD quintile broadly mirror the population distribution in Kirklees, with 28.4% of deaths and 30.9% of the population in areas defined as amongst the most deprived 20% in England, and 10.3% of deaths and 10.5% of the population in areas defined as amongst the least deprived 20% in England.
Figure 13: Proportion of registered deaths (2023) and population (2022), by deprivation quintile (IMD 2019)
Source: Office for National Statistics
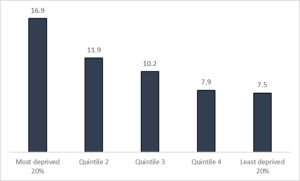
However, this comparison does not take into account differences in age profiles between areas of differing levels of deprivation. The most deprived areas of Kirklees tend to have younger populations, and older people tend to live in the least deprived areas. Numbers of deaths generally increase with age, so based on population age profiles proportionally more deaths would be expected in our least deprived areas (and fewer deaths in our most deprived areas).
Taking age profiles into account, all-age directly standardised mortality rates for 2021-23 show people in the most deprived areas of Kirklees (defined as amongst the most deprived 20% of areas in England) have a mortality rate of 16.9 per 1000 population, compared with a rate of 7.5 for people in the least deprived areas of Kirklees (defined as amongst the least deprived 20% in England).
Figure 14: Kirklees all-age directly standardised mortality rates per 1000 population, 2021-23
Source: Office for National Statistics
These differences will have an impact on life expectancy – see next section.
4.4 Life expectancy
4.4.1 Life expectancy comparisons
The latest available data published by OHID shows Kirklees life expectancy at birth (calculated over the three-year range 2021-23) to be significantly lower than the national average, with Kirklees males having a life expectancy of 77.9 years (compared with an England value of 79.1) and Kirklees females having a life expectancy of 81.6 years (compared with an England value of 83.1). Kirklees males have a similar life expectancy to the Yorkshire and Humber average, but Kirklees females have a significantly lower life expectancy than the regional average.
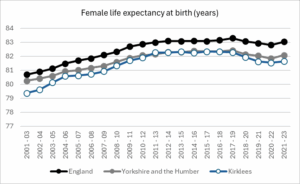
4.4.2 Trends in life expectancy
Data published by OHID shows that a consistent long-term trend of increasing life expectancy in Kirklees ended around the year 2013. Between 2001-03 and 2012-14 life expectancy at birth (calculated over a three-year range) increased by an average of around 0.3 years per year for both males and females in Kirklees. Between 2013-15 and 2017-19, life expectancy at birth showed minimal change for males and females. This flattening of the life expectancy trend was well established prior to the COVID-19 pandemic, and is reflected in national trends as well as in Kirklees.
As described in section 4.3 above, excess deaths seen during the COVID-19 pandemic (beginning March 2020) have contributed to a recent reduction in life expectancy. Although life expectancy has risen in the latest year, published data shows that life expectancy at birth in Kirklees in 2021-23 is still 0.7 years lower than the pre-pandemic level (2017-19) for males, and 0.6 years lower for females. Equivalent comparisons for Yorkshire and the Humber and England show a decrease of around 0.3 years for male life expectancy and around 0.6 years for female life expectancy, both regionally and nationally.
Figure 15: Male life expectancy at birth (years), 2001-03 to 2021-23

Source: Fingertips (https://fingertips.phe.org.uk/)
Figure 16: Female life expectancy at birth (years), 2001-03 to 2021-23
Source: Fingertips (https://fingertips.phe.org.uk/)
4.4.3 Life expectancy by electoral ward
Based on local data for 2021-23, male life expectancy at birth is highest in Holme Valley South (82.4 years), Mirfield (80.8 years) and Denby Dale (80.6 years). Male life expectancy at birth is lowest in Dewsbury West (74.1 years), Ashbrow (74.9 years) and Dewsbury East (75.3 years). The difference between the highest and lowest male life expectancies at ward level is 8.3 years.
Figure 17: Map of male life expectancy at birth (years), 2021-23
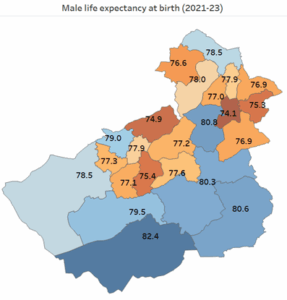
Source: Local calculations based on registered deaths (2021-23) and mid-year population estimates (2022)
Female life expectancy at birth is highest in Holme Valley South (85.2 years), Holme Valley North (83.9 years) and Lindley (83.7 years). Female life expectancy at birth is lowest in Ashbrow (79.2 years), Newsome (79.2 years) and Batley East (79.6 years). The difference between the highest and lowest female life expectancies at ward level is 6.0 years.
Figure 18: Map of female life expectancy at birth (years), 2021-23
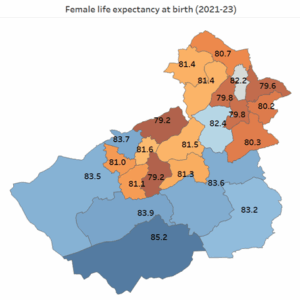
Source: Local calculations based on registered deaths (2021-23) and mid-year population estimates (2022)
4.4.4 Life expectancy by deprivation
Based on local data for 2021-23, male life expectancy at birth is 9.7 years higher in areas of Kirklees that are amongst the least deprived 10% of areas in England (least derived decile), compared with those areas amongst the most deprived decile (82.8 years in the least deprived areas; 73.1 years in the most deprived areas). The equivalent female life expectancy gap between the least and most deprived areas is 7.1 years (female life expectancy of 84.9 years in the least deprived areas and 77.8 years in the most deprived areas).
Figure 19: Male life expectancy at birth (years) by deprivation decile, 2021-23
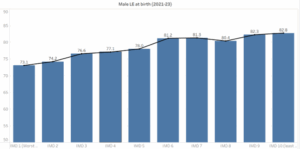
Source: Local calculations based on registered deaths (2021-23) and mid-year population estimates (2022)
Figure 20: Female life expectancy at birth (years) by deprivation decile, 2021-23

Source: Local calculations based on registered deaths (2021-23) and mid-year population estimates (2022)
4.5 Migration
4.5.1 Place of birth and length of residence
According to the 2021 census, 87.4% of the Kirklees population was born in the UK, with an additional 3.2% born elsewhere in Europe, 7.4% born in the Middle East and Asia, 1.3% born in Africa and 0.6% born in the Americas and Caribbean.
Of the 12.6% of the Kirklees population not born in the UK:
- 4% had lived in Kirklees for 10 years or more;
- 7% had lived in Kirklees for 5 years or more, but less than 10 years;
- 2% had lived in Kirklees for 2 years or more, but less than 5 years;
- 3% had lived in Kirklees for less than 2 years.
4.5.2 Migration in year prior to 2021 census day
In total, 91.4% of 2021 census respondents in Kirklees were living at the same address one year earlier. Within the year prior to the 2021 census day, 7.6% had moved into Kirklees from another UK address, 0.7% had moved into Kirklees from outside the UK, and 0.4% had a student term-time or boarding school address in the UK.
4.5.3 Short-term residents
According to the 2021 census, Kirklees had 644 non-UK short-term residents – this includes people who had arrived in the UK within the year before census day and did not intend to stay longer than 12 months.
4.5.4 Asylum seekers and refugees
According to Migration Yorkshire, as of the end of September 2024 there were 854 supported asylum seekers in Kirklees, all in dispersal accommodation. In addition, there were 529 arrivals under the Homes for Ukraine scheme and 130 people via the Afghan Resettlement Programme
On 31 March 2024, there were 38 looked-after unaccompanied asylum-seeking children in Kirklees. Between January 2014 and September 2024, there have been 162 resettled refugees in Kirklees, the majority (129) via the Vulnerable Persons Resettlement Scheme.
4.5.5 National Insurance Number Registrations
UK Government data for Kirklees shows there were 3,270 National Insurance Number registrations to adult overseas nationals entering the UK in the year ending September 2024.
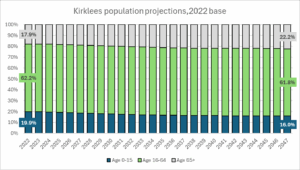
4.6 Population projections
The latest available population projections from the Office for National Statistics at Local Authority level were released in June 2025, using 2022-based population estimates. These projections show an increase in the older population, from 17.9% of the Kirklees population being aged 65 and over in 2022 to 22.2% in 2047. The projections show decreases in the Kirklees population aged 0-15 (from 19.9% in 2022 to 16.0% in 2047) and in the Kirklees population aged 16-64 (from 62.2% in 2022 to 61.8% in 2047).
These projections equate to around 26,700 more older people (aged 65+) and 11,400 fewer younger people (aged 0-15) in 2047, compared with 2022.
Figure 21: Kirklees population projections (2022 base), 2022 to 2047
Source: Office for National Statistics
Data sources
4.1.1 Components of change
ONS Analysis of population estimates tool for UK:
https://www.ons.gov.uk/peoplepopulationandcommunity/populationandmigration/populationestimates/datasets/analysisofpopulationestimatestoolforuk
4.4.1 and 4.4.2 Life expectancy comparisons and trends
Male:
https://fingertips.phe.org.uk/profile/health-profiles/data#page/4/gid/1938132696/pat/6/par/E12000003/ati/302/are/E08000034/iid/90366/age/1/sex/1/cat/-1/ctp/-1/yrr/3/cid/4/tbm/1/page-options/car-do-0
4.5.4 Migration Yorkshire statistics:
https://www.migrationyorkshire.org.uk/statistics/refugee-and-asylum-seeker-dashboard
https://www.gov.uk/government/statistical-data-sets/immigration-system-statistics-regional-and-local-authority-data
4.5.5 National Insurance Number registrations
https://stat-xplore.dwp.gov.uk/
4.6 Population projections: https://www.ons.gov.uk/peoplepopulationandcommunity/populationandmigration/populationprojections/datasets/localauthoritiesinenglandtable2
See also: KJSA sections on Inequalities and Individuals
Date updated (and lead author initials): 23/07/25 (OR)