 Children with Special Educational Needs or Disabilities (SEND)
Headlines
Introduction
What is the KJSA?
Each Local Authority is required to carry out a Kirklees Joint Strategic Assessment (KJSA) in order to understand the current and future needs of the population and to use this information to plan the provision of services and resources. This document looks at the needs of children & young people aged 0 to 25 years in Kirklees living with Special Educational Needs and Disabilities (SEND).
The KJSA gathers information and data from a variety of sources across the Kirklees partnership and from national datasets to provide a rich picture of current needs and forecasted trends. Where possible we have benchmarked our information against national statistics and regional comparators. The information includes population data, health needs, social care needs and educational outcomes and identifies the interdependencies between these factors.
It is also important that the KJSA captures the voice of children and families so that we can understand what it means to them. The KJSA will continue to be updated and evolve over time as new data becomes available and services are evaluated. We will continue to talk to children and families to help us to understand their needs and improve our services.
The KJSA forms part of a suite of documents which inform our SEND planning process in Kirklees. Information and data from the KJSA is used to inform our SEND Joint Commissioning Strategy which describes how we will plan and provide services and our SEND Transformation plan which describes how SEND provision in Kirklees will be developed.
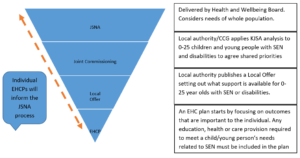
In Kirklees our partnership will use our joint understanding of the KJSA (Kirklees Joint Strategic Assessment) to determine the outcomes we seek to achieve. We will also develop an ‘Outcomes Framework’ to ensure we measure the impact we are making against the issues that really matter. The diagram below illustrates how the KJSA informs different stages of the process and how information is fed back into the KJSA.
What do we mean by SEND?
SEND is a term which encompasses children and young people with Special Educational Needs (SEN) and / or a Disability.
The 2015 SEND Code of Practice defines children and young people as having Special Educational Needs if they: “have a learning difficulty or disability which calls for special educational provision to be made for him or her”
The 2010 Equality Act defines someone with a disability as having: ‘…a physical or mental impairment which has a long-term and substantial adverse effect on their ability to carry out normal day-to-day activities’. ‘Long-term’ is defined as ‘a year or more’ and ‘substantial’ as being ‘more than minor or trivial’. This is a relatively broad definition and includes a range of conditions including sensory impairments and long-term health conditions such as asthma or epilepsy.
Pupils with special educational needs are currently classified as follows:
SEN Support
From 2015, the School Action and School Action Plus categories have combined to form one category of SEN support. Extra or different help is given from that provided as part of the school’s usual curriculum. The class teacher and special educational needs co-ordinator (SENCO) may receive advice or support from outside specialists. The pupil does not have an education, health and care plan.
Education, Health and Care (EHC) Plans and statements of SEN
A pupil has an EHC plan or statement of SEN when a formal assessment has been made. A document is in place that sets out the child’s need and the extra help they should receive. Following the introduction of EHC plans in September 2014, statements of SEN and EHC plans are grouped together within the data. The transfer of statements of SEN to EHC plans was due to be completed in March 2018; in December 2018 there were less than 100 statements of SEN nationally (2).
Why is this issue important?
To reach their potential and make a positive contribution to society, children and young people with disabilities along with their families, need coordinated support from health, education, social care and voluntary services. This needs to be integrated and joined up to ensure the most effective and efficient commissioning and targeting of resources for this population.
Children living with special educational needs and/ or disabilities and their families can face multiple challenges that may require diverse and specialist responses from services. The needs of disabled children, young people and their families are unique to them, are sometimes complex, and change over time.
Our challenge is to understand these needs and develop a system around them that is flexible and responsive. The number of children living with a disability, living longer with a disability and the complexity of some disabilities is increasing due to improvements in medical technology and interventions.
SEND population
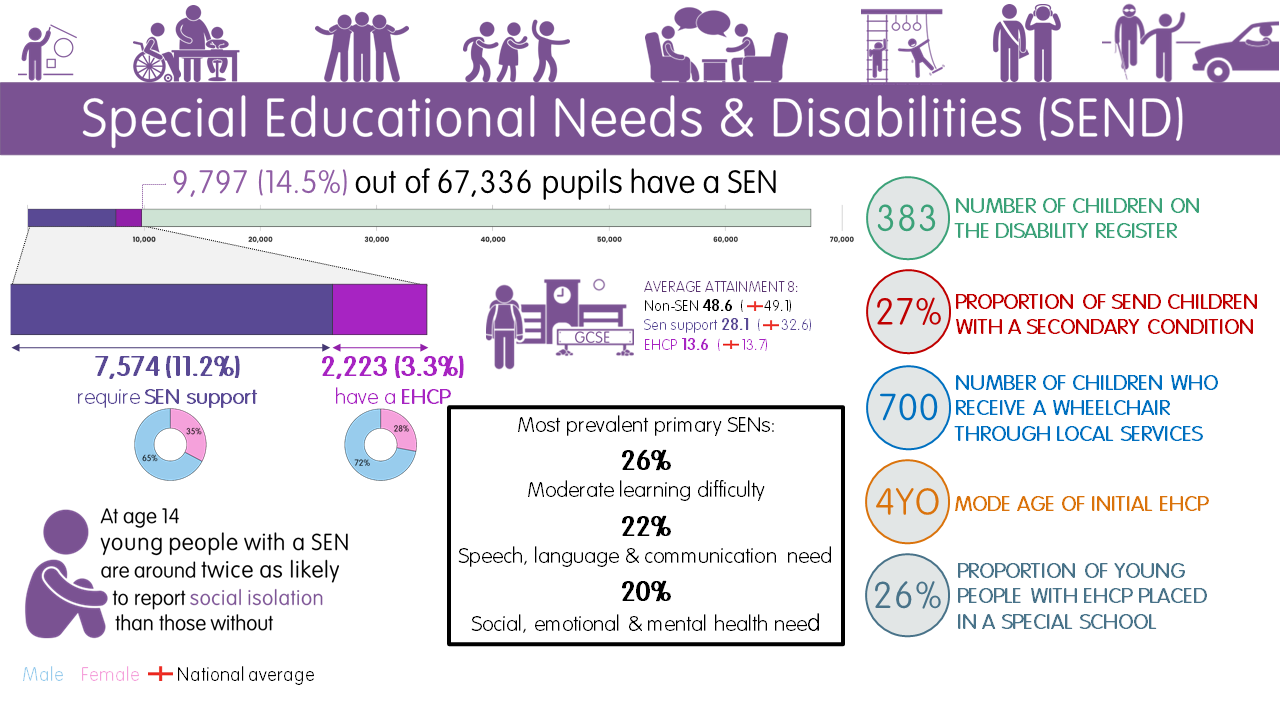
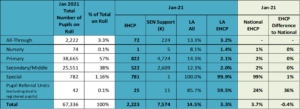
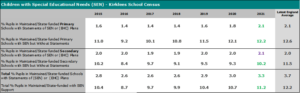
Based on Kirklees School Census, January 2021, there are 67,336 pupils on roll at Kirklees maintained schools and academies, including nursery schools and pupil referral units, aged 5-18. This is an increase of 1,548 pupils (2% increase) from 65,778 pupils in January 2015.
14.5% have some level of special educational need or disability (SEND). This equates to around 9,797 children locally.
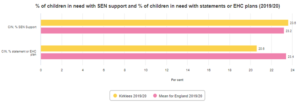
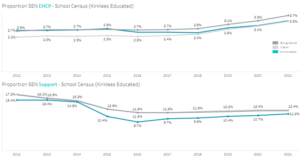
11.2% of pupils on roll at Kirklees schools in 2021 (National 12%) have a SEND requiring Special Education Needs (SEN) support, with an increase of 0.6% from 10.6% in 2015 (incl School Action/Action Plus) and in increase of 3.6% from 7.6% in 2015 (incl School Action Plus). This equates to around 7,574 children, of whom there are more at primary schools (4,724) than secondary schools (2,609).
3.3% (2,223 pupils) of pupils on roll at Kirklees schools in 2021 (National 3.7%), with an increase of 0.5% from 2.8% (1,831 pupils) in 2015, have an Education, Health and Care Plan (EHCP). EHCPs were introduced from September 2014 as part of a range of SEND reforms. Prior to this, children had ‘statements’ of SEN.
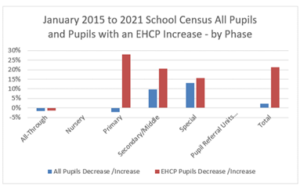
Numbers of all pupils in Kirklees LA schools and academies have increased by 2% and pupils with an EHCP have increased by 21% since January 2015 to January 2021 (National increase 40%). The difference by school phase can been seen below, with a decrease in all pupils but increase in those with a Statement/EHC Plan.
Breakdown of type of school for Kirklees School Census (age 4-19) January 2021:
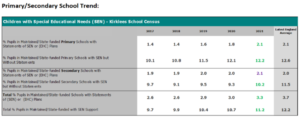
Primary/Secondary school trend:
All Kirklees Responsible Children & Young People with an EHC Plan
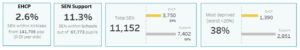
As well as the 2,223 school aged children in Kirklees LA schools/academies with an EHCP, there are other children & young people, aged 0-25, with an EHCP maintained by Kirklees (October 2021):
 (Tableau dashboard/LA Synergy Education database MIS/LA LiquidLogic Social Care database, 30 October 2021)

Age breakdown of all LA responsible EHC Plans (Jan 2019 – 2021) – children and young people 0-25: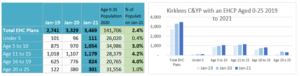
SEN2 DfE Return, January 2021 / ONS Population data, 2020.
Which groups are affected most by this issue?
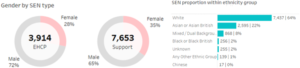
Locally, the number of male children and young people with an EHC Plan (Kirklees responsible) or SEN Support (in Kirklees LA schools/academies) is much higher than the number of females. In July 2021, around a third of pupils with SEN are female and two thirds or more are male (19).
Three in five (64%) SEN students are of White British ethnicity and one in four (22%) are Asian.
(Tableau dashboard/LA Synergy Education database MIS/LA LiquidLogic Social Care database, 30 October 2021)
Where is this causing greatest concern?
SEND children with an EHCP reside across Kirklees localities (19); there are of course a small number of children who are not known to services and therefore not included in this overview.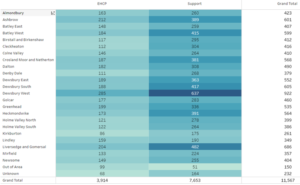
| The high needs cohort and deprivation
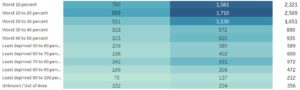
The most widely adopted measure of deprivation in England is the Indices of Multiple Deprivation (IMD) (27).The IMD combines a number of indicators into a single deprivation score for geographic areas. Poverty and deprivation are complex issues with no single cause but rather a multitude of contributory factors. Deprivation can affect life chances, the ability to find and maintain employment, the quality of housing which is affordable and the ability to ensure that it is heated to a comfortable level. Living in poverty also has a significant impact on physical and emotional health. Nationally, in the general population the gap in life expectancy between people living in the lowest and highest income neighbourhoods is six years. In Kirklees, people in Dewsbury West can expect to live 2.3 years (females) to 4.4 years (males) fewer than people in Kirkburton (based on life expectancy at birth calculated between 2015 and 2017). When we compare the EHCP cohort with the general population we see they are overrepresented in the lowest 10%, 20% and 30% deciles. The imbalance reverses in all other deciles; this trend has been stable for the last few years (19).
When IMD is analysed at category of need level, there are some minor variances in each need category. However, there are large variances in the Complex Communication and Interaction cohort who are under-represented in more deprived areas and over-represented in more affluent part of Kirklees. For further information please see: KJSA Poverty Section |
Free School Meal Eligibility
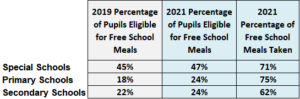
Locally, there are now around half (47%) pupils in special schools known to be eligible for free school meals (with 71% of those pupils taking up a free school meal on January 2021 School Census day), in comparison to state primary schools at 24% and state secondary schools at 18% (15)
Rates in England are just under half (43%) for special schools (an increase from 38% in 2019), 19% for state primary and 22% for state secondary (11).
What significant factors are affecting this issue?
Birth and Early Years
Infant mortality (deaths before first birthday) and disability
Preterm birth, low birthweight babies (less than 2500g), stillbirth and infant mortality are indicators of the broader health and wellbeing of populations; they can be highly traumatic for those affected by them. Positive health behaviours, access to maternity and genetic counselling services and an increased understanding of the impact of pregnancy as a result of relationships within the family have all contributed to lower rates of preterm birth, stillbirth and infant mortality in recent years.
Babies who are born preterm (before 37 completed weeks of pregnancy) are not fully prepared to live outside the mother’s womb and have an increased risk of long-term physical and neurological health issues and mortality. Babies whose weight is normal are less likely to develop childhood asthma, become obese, or suffer diabetes late in life.(4) Babies who are born early are more likely to have a low birth weight although full term babies can also have a low birthweight.
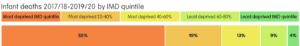
In 2019/20, the proportion of full-term babies who had low birth weight was 2.6% (which is not significantly different than the rate for England (2019), 2.9%). There are clear inequalities depending on IMD quintile; full term babies born to mothers living in the most deprived IMD quintile are six times more likely to have low birth weight (3.0%) than those born to mothers living in the least deprived 20% (0.5%). (CHFT & MYHT combined delivery data 2019/20).
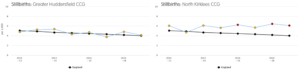
In 2017-19, Kirklees had a significantly higher rate of stillbirth compared to nationally (5.1 compared to 4.0 per 1000 births). The rate in North Kirklees was 1.5 times higher than in Greater Huddersfield. The infant mortality rate in Kirklees (2017-2019) has risen sharply in recent years and is the highest it has been for a decade: 6.2 per 1000 births in Kirklees compared to an England rate of 3.9/1000.
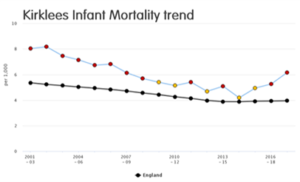
Again, there are inequalities depending on area; the infant mortality rate in Greater Huddersfield was 5.2/1000 compared with 7.2/1000 in North Kirklees. Over half of infant deaths between 2017/18 and 2019/20 were babies living in the most deprived IMD quintile.
| Children with life-limiting conditions
Life-limiting conditions are those for which there is no reasonable hope of cure and from which children will die, either during childhood or in early adulthood. Having such a condition brings with it medical and emotional complications which add to the burden of disability and ill health. Many children with life-limiting conditions are also disabled and have additional long-term needs. The most common life-limiting conditions (but each accounting for less than 25% of deaths) are cancer, perinatal conditions and congenital abnormalities, conditions relating to the nervous and muscular-skeletal systems, and organ failure. |
Communication and Language Development
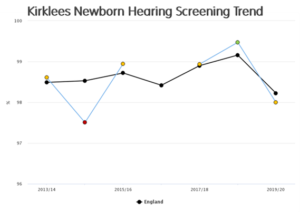
New-born hearing screening is routinely undertaken in England during the neonatal period. The proportion of babies in Kirklees offered hearing screening in 2019/20 was 98.0%, similar to nationally (98.2%).
A child might be delayed in responding to sounds, simple requests or beginning to talk compared to the typically developing child, this can have an impact across the development of a child because they can become increasingly behind their peers.
Children living in poverty in the UK suffer disproportionately from language delay. Poverty can strongly reduce parents’ ability to respond to their child’s early language needs and offer a home learning environment that enhances language skills. As a group, children from disadvantaged backgrounds more commonly have reduced developmental opportunities. (8)
Behaviour
Some behavioural difficulties are more likely in children with particular medical conditions or disabilities for example, attention deficit hyperactivity disorder (ADHD) and autism spectrum disorder (ASD). Children with learning, sensory or physical disabilities may have delayed or no speech and need alternative ways to communicate (10). An assessment of our local special school population found 10% of the special school population having challenging behaviour (9). This potentially presents greater issues for carers as the child grows up.
What does the local data tell us?
Education
Where are pupils with SEND educated within Kirklees?
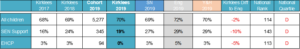
Kirklees and National Trend – School Census (31):
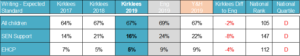
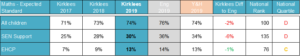
The DfE matrix (31) shows a slight increase of EHCP in Kirklees LA Schools from 2.8% in 2015 to 3.3% in January 2021 (just under national 3.7% 2021). SEN Support has increased from 10.4% to 11.2% 2015 to 2021 (just under national 12.2% 2021).
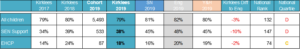
Statistical Neighbours Placement Types (SEN2 (32):
Post-16 Destinations
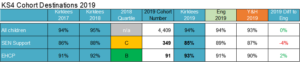
Attainment Outcomes

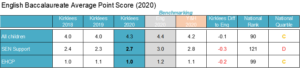
Attainment amongst the EHCP and SEN Support population is below or just below national averages at almost every key stage throughout school education (33)
2020 and 2021 Primary school assessments and GCSE exams were cancelled by the Department for Education, due to the Covid-19 pandemic affecting schools and pupil attendance
Primary School Attainment Outcomes 2019
Early Years Foundation Stage Profile 2019 – Good Level of Development
Early Years Foundation Stage Profile (EYFSP) Pupils achieving a Good Level of Development (GLD) or above at the end of Reception, with EHCP pupils (94 pupils) 5% lower than national (1% lower in 2018) and SEN Support pupils 10% lower than national (4% lower in 2018).
Phonics 2019
Pupils taking the Phonics Check at the end of Year 1 Working at the Expected Standard or above. EHCP pupils are 1% lower than national EHCP pupils and SEN Support pupils are 10% lower than national SEN Support pupils.
Key Stage 1 2019
 Key Stage 1 Pupils achieving the Expected Standard (EXS) or above in Reading, Writing and Maths and combined in all three (RWM) at the end of Year 2. EHCP pupils are 2% lower than national EHCP pupils in RWM combined (111 pupils) and SEN Support pupils are 7% lower than national SEN Support pupils.
Key Stage 2 2019
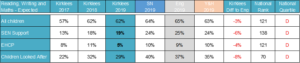
Key Stage 2 Pupils achieving the Expected Standard (Exp) or above in Reading, Writing and Maths combined (RWM) at the end of Year 6 Primary School. EHCP pupils are 4% lower than national for RWM combined (+2% above in 2018) and SEN Support pupils are 7% lower than national (and were 6% lower in 2018). Non-SEN and all pupils are also 4% lower than national non-SEN.
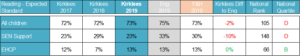
Key Stage 1-2 Progress 2019:
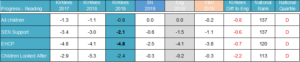
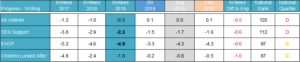
Progress of Pupils between Key Stage 1 (Year 2) and Key Stage 2 (Year 6).
Zero is the national benchmark for all pupils. The Department of Education’s threshold for all pupils falling below average was -2.80 in Reading and -3.00 in Writing and Maths (although this is no longer a DfE threshold) – Kirklees EHCP and SEN Support pupils are within this threshold but slightly lower than national EHCP and SEN Support pupils.
Attainment Secondary
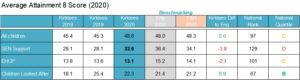

GCSE Pupils achieving Average Attainment 8 Score (2020) in 8 chosen subjects at the end of Secondary School. Kirklees EHCP pupils are in line with national pupils. SEN Support pupils (32.6) score 5 lower than national (36.4).
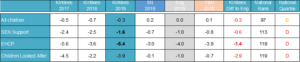
Progress of Pupils between Key Stage 2 (end of Primary school) to GCSE (end of Secondary School 2019) in 8 chosen subjects, with zero being the national benchmark for all pupils. Kirklees pupils with an EHCP were in line with national EHCP in 2019 and 2018. Pupils with SEN Support achieved lower than SEN Support children nationally, on average from their starting point.
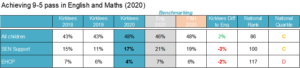
In 2020, 4.2% of pupils with an EHCP (2.3% lower than national) and 17.2% of pupils with SEN Support (3.3% lower than national) achieved 9-5 in English and Maths.
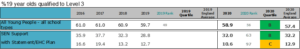
19 year olds
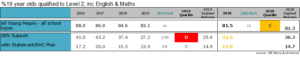
EHCP young people achieved similar to national EHCP young people in 2019 at Level 2 including English & Maths A-Level, whilst SEN Support young people achieved 27.6% (9% lower than national SEN Support young people, and 48% lower than non-SEN). However, this is increasing and was 32.6% (3.7% lower than national) in 2020 for young people with SEN Support.
Absence
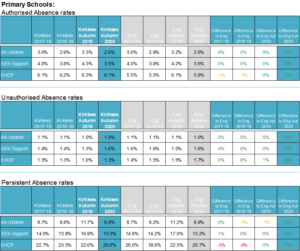
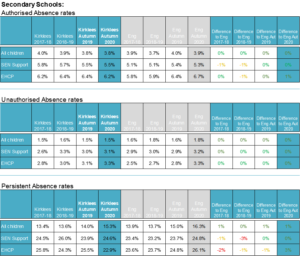
PA is broadly in line with national figure with the exception of EHCP and SEN Support. This could be a result of the phased return to school and Covid-19 reasons such as illness or transport.
Exclusion Rate Trends – Kirklees LA Schools and Academies
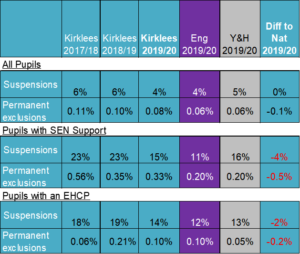
(DfE SFR 2019/20)
Suspensions 2019/20
- Secondary School SEN suspensions rate was 29% in 2019/20, with a difference to national SEN narrowing to 8% (2018/19 difference to national was 15%). Secondary school breakdowns by SEN Support and EHCP differences to national are 8% and 6% respectively
- Primary School SEN suspensions rate was 7% in 2019/20, with difference to national SEN narrowing to 2% (2018/19 difference to national was 3% and 2017/18 was 6%)
- Special School SEN suspensions rate was 1% in 2019/20, which is 7% lower than national (2018/19 and 2017/18 was also 1%, which was 11% lower than national). Special school SEN Suspensions has been lower than national Special school SEN pupils since 2014/15
Permanent Exclusions 2019/20
- Secondary school SEN Permanent Exclusions rate was 0.5% in 2019/20, with a difference to national SEN of 0.2% (2018/19 difference to national was 0.6%, similar to national). Secondary school breakdowns by SEN Support and EHCP differences to national are 5% and 0.4% respectively
- Primary school SEN Permanent Exclusions rate was 0.2% in 2019/20, with a difference to national SEN of 0.1% (2018/19 difference to national was 0.2%, similar to national)
- Special school SEN Permanent Exclusions rate was 0% in 2019/20 and has been since at least 2006/07. This is 0.04% lower than national in 2019/20
The Exclusion rate for all pupils is generally in line with national for suspensions for 19/20 and slightly higher for permanent exclusions. In regard to learners with EHCP’s suspensions and are higher than national (2%) and permanent exclusions are in line with national (0.2%). Learners on SEN support are higher than national in both measures. 4% suspensions and 0.5% permanent exclusions.
The Local Authority encourages a clear message has been that schools must seek advice and support from Ethos Academy Social Emotional and Mental Health (SEMH) outreach service or Educational Psychology before moving to exclude a child or young person.
The increased in suspensions and permanent exclusions are being addressed in the SEND transformation plan through the inclusion strand underpinned by the futures strategy.
DfE warning: Covering the 2019/20 academic year, this year’s data includes the start of the pandemic when, from 23 March, school sites were closed for all but those children of critical workers and vulnerable children, with others being educated remotely. Permanent exclusions and suspensions were possible throughout the full academic year but comparisons to previous years should be treated with caution.
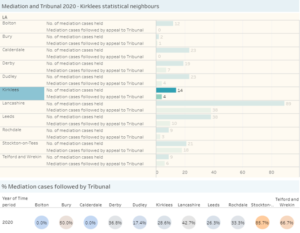
Statutory Compliance Reporting
20 weeks Compliance – by Calendar Year
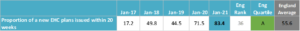
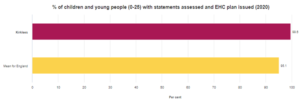
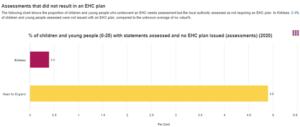
 We have seen a significant improvement in the proportion of all new EHC plans issued within 20 weeks at over 80% placing Kirklees in the 1st quartile (January 2020) on the DfE LA Matrix (31). Our current performance however does fluctuate over quarterly periods. We know there is further work to do in relation this, particularly in relation to yearly reviews.
New Plans
Children and young people with SEND with social care involvement
As with the general child population, typically a series of complex factors lead to disabled children and young people becoming looked after, which may combine around family stress, the capacity of families to meet the care needs of their disabled child, neglect or abuse and in some instances parental illness and disability.
The experience of being looked after also potentially increases the likelihood of developing emotional ill health issues. This is likely to be primarily assessed as a SEN; it should be borne in mind some children solely present with emotional and behaviour challenges under the heading of disability, which may inflate overall SEN in the looked-after population.
Children in Need – There are currently 1,039 Children in Need in Kirklees. Of these 1 in 4 (24%) have an identified SEN or SEND. These range across all areas of need. In 2019/20, there were 20.6% with an EHCP (lower than national 23.4%) and 23.6% with SEN Support (similar to national 23.2%).
Children with Protection Plan – There are currently 276 CYP in Kirklees with a Child Protection Plan, of these 1 in 5 (20%) have an identified SEN or SEND.
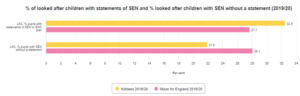
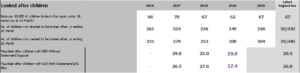
Looked after Children – Locally, we know there are around 654 looked after children of school age, of which over 1 in 4 (29%) have a SEN. In 2019/20, there were 32.5% with an EHCP (higher than national 27.7%) and 21.9% with SEN Support (lower than national 28.1%)
Understanding Needs of Children with SEND
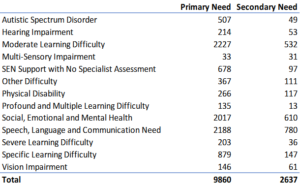
Many children with SEND do not have a single disability or need. This is best understood in our local special school population. Of the 9,860 children in Kirklees Local Authority schools/academies 2,637 (27%) have a secondary disability or condition (15).
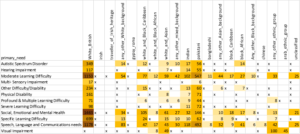
It is important to note that, whilst a single primary issue may be recorded for a child, they may have multiple issues relating to mental or physical health, communication or behaviour. Below is an overview of the Kirklees School Census SEND population (Department for Education Primary Need set), based on identified primary need, or the need that has greatest impact upon their daily lives.
Disability can occur in any socioeconomic group. However research suggests that disability appears to be not simply an accident of birth but can be a “confluence of intergenerational poverty and modern medical progress”. The extent to which factors such as low income precede or follow disability is difficult quantify locally, but what we know is that poor diet and stressful living conditions do increase the chances of premature birth and low birth weight which are indicators of future disability. (16)
Local levels of Primary Need by school type:
In Primary Schools, Primary Need is higher in Kirklees LA schools/academies than national for:
- Moderate Learning Difficulty at 25.5% (national 18.3%)
- No specialist assessment 9.1% (national 4.2%)
In Secondary Schools, Primary Need is higher in Kirklees LA schools/academies than national for:
- Speech, Language and Communication at 25.2% (national 21.5%)
In Special Schools, Primary Need is higher in Kirklees LA schools/academies than national for:
- Speech, Language and Communication at 16% (national 8.5%)
- Profound and Multiple Learning Difficulty at 15.6% (national 6.2%)
- Social, Emotional and Mental Health at 15% (national 12.7%)
Source: LG Inform
Communication and interaction needs
Autistic Spectrum Condition (ASC)
Autistic spectrum condition (ASC) is a lifelong condition characterised by impairments in three main areas: social interaction, communication and the presence of repetitive behaviours (known as the triad of impairments). The term spectrum is used due to the significant variations between individual cases, including severity and presentation of the triad of impairments; differing IQ levels; and general functional abilities. Autistic Disorder, Asperger Syndrome and High Functioning Autism are all types of Autistic Spectrum Condition. There are 499 children educated locally with a diagnosed ASD (with 421 in 2019). As of July 2021 there are 789 children on the waiting list for a neurodevelopmental assessment.
Table 1 shows a breakdown of ASC by school population in Kirklees (18)
![]()
Table 1: Autistic Spectrum Disorder (2021)(15)
Communication needs
Some children and young people find it difficult to listen, understand and communicate with others and may need support to develop the surprising number of skills involved.
Children with Speech, Language and Communication Needs (SLCN) may have difficulty with one or more speech, language or communication skills. For example, a child may have difficulties with listening and understanding or with talking or both. Each child also has a unique combination of strengths. This means that every child with SLCN is different.
Table 2 shows a breakdown of speech, language and communication needs by school population with 2,193 in January 2021 (compared to 1,883 in 2019)

Table 2: Speech, Language and Communications Needs (2021)(15)
Learning disability
Learning disabilities are usually detected in childhood and can be caused by genetic factors, infection prior to birth, brain injury at birth, brain infection, brain damage after birth or the cause may be unknown. There are many conditions associated with learning disabilities, perhaps the most well-known being Down’s Syndrome. The effects of learning disabilities can be far-reaching, including issues with speech and communication which can result in, or be associated with behavioural problems. There are 3,449 children in Kirklees who have some form of learning disability in January 2021 (similar to 3,452 in 2019); a breakdown by type is show in table 3 below. Learning disability does not include all those who have a ‘learning difficulty’ which is more broadly defined in education legislation.
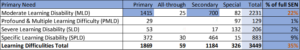
Table 3: Breakdown of Learning disabilities (2021) (15)
Physical disability and sensory impairment
There are many forms of physical disability and sensory impairment that can affect children across the life course. In Kirklees there are 666 as at January 2021 (with 631 in 2019) children with physical disabilities or sensory impairments; a breakdown is shown in table 4 below.
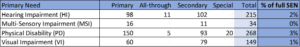
Table 4: Breakdown of physical disabilities (2021)(15)
Social, emotional and mental health
Social, emotional and mental health (SEMH) needs refer to special educational needs in which children/young people have severe difficulties in managing their emotions and behaviour. They often show inappropriate responses and feelings to situations which means that they have trouble building and maintaining relationships with peers and adults and they can also struggle to engage with learning and to cope in mainstream education. Children with SEMH will often feel anxious, scared and misunderstood. Table 5 shows a breakdown of SEMH needs by school population with 2,116 children in 2021 (an increase from 1,708 in 2019).
![]()
Table 5: Number of those with social, emotional or mental health needs (2021) (15)
Undiagnosed or other needs
There are a number of children with a range of other physical, emotional and learning needs that are not formally identified but education professionals find these children benefit from additional support or interventions. These are shown in table 6 totalling 1,055 in January 2021 (an increase from 965 in 2019).

Table 6: Undiagnosed or other needs (2021)(15)
Primary Need by Ethnicity
Similarly to gender, the EHCP cohort and the ethnicity of the general 0-25 population has been compared. Unlike gender, ethnicity tends to match the general population with one exception; those in the Pakistani ethnic group are slightly over-represented in the EHCP cohort (11).
x=low number supressed
Understanding future trends
There are important factors that will influence the future shape of the local SEND population.
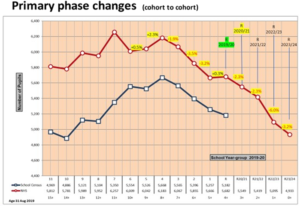
There is a declining trend in all children in the primary school phase which is expected to continue. We can only see NHS data for 0-year-olds of course but ONS shows the same decline before levelling out more into the future (0-4 year olds). As of July 2021, we expect a decline of 2.3% of pupils entering primary Reception years (aged 4-5) in September 2021, with a decrease each year totalling 11.5% over the next 3 years, which would equate to around 700 less primary pupils (NHS birth data, 2020)
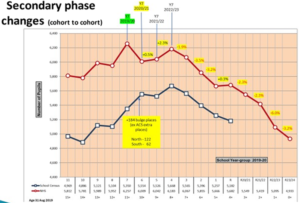
With secondary there will continue to be an incline in cohort sizes to 2022/23 before a declining trend. Only migration/house building is likely to change this significantly over time. As of July 2021, we expect an increase totalling 2.8% of pupils entering secondary schools/academies Year 7 (aged 12-13) in September 2021 and 2022, equating to around 200 pupils. Then as of September 2023, we expect the primary pupils decline to filter through to Year 7, with a decrease over 8 years totalling 22%, which would equate to around 1,300 less secondary pupils (NHS birth data, 2020)
The proportion of SEND children is likely to grow at least the same rate (9).
Bearing in mind that there has been an increase in Kirklees school population of 1,548 (2%) since 2015, we can see a growth in Primary Need for pupils with an EHCP. We also need to consider Primary Needs of SEN Support pupils, with Moderate Learning Disability (MLD), Social, Emotional & Mental Health and Speech (SEMH), Language and Communication Needs (SLCN) having the highest numbers (Spring School Census).
The graphs below illustrate the trends in primary need for children with an EHCP and SEN support. This shows an increasing need in terms of Autism Spectrum Conditions, Social, Emotional & Mental Health, Speech, Language & Communication Need and Specific Learning Disability.
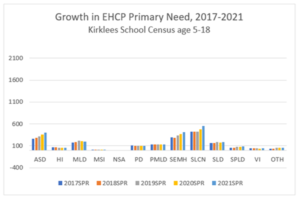
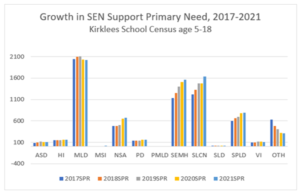
Autistic Spectrum Disorder (ASD), Hearing Impairment (HI), Moderate Learning Disability (MLD), Multi-Sensory Impairment (MSI), Physical Disability (PD), Profound & Multiple Learning Difficulty (PMLD), Social, Emotional & Mental Health (SEMH), Speech, Language & Communication Need (SLCN), Severe Learning Disability (SLD), Specific Learning Disability (SPLD), Visual Impairment (VI), Other Difficulty/Disability (OTH)
Housing
The housing needs of disabled children affects the whole family. Issues around climbing stairs, lack of space, downstairs facilities, cold and damp are most common (12). Locally, two in five (44%) carers tell us that their home is too small for them, one in three (39%) felt their home was in need of repair and one in four (22%) felt their home was unsuitable for their mobility needs or the needs of people in the household (13). As children grow up, particularly those with mobility problems, there are additional requirements such as movement and handling equipment and it is not uncommon for hoists and other specialist equipment being required for older children who are not ambulant.
Wheelchairs, Equipment, Assistive technology, and Access to Buildings
Provision of a suitable wheelchair or other equipment, such as moving and handling, mobility, postural seating and changing facilities can be of vital importance to enable children to safely access education. Without their equipment children can be forced to miss school or attend in some discomfort and inconvenience which can significantly impact on their education outcomes. Similarly, access to buildings and classrooms can mean the difference between a child being able to attend the school of their choice or not.
Equipment for Kirklees Children and Young People is provided through a pooled budget with contributions from Health, Social Care and Education to allow equipment to be provided in the most appropriate setting. In 2020/21 392 children were provided with equipment in total (into their home or school), with 261 items of equipment being provided into 61 educational settings.
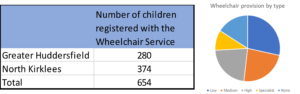
654 children were registered with the Wheelchair service in Kirklees in December 2019. (14). The higher wheelchair user prevalence in North Kirklees reflects the greater numbers of children with an EHCP or SEN support.
Wheelchair provision is categorised as low need, medium need, high need, and specialist. Some assessments result in no equipment being provided. The breakdown is illustrated below.
 There is a developing range of assistive technology that is available and designed for the needs of the SEND population. Technology will play an increasingly important role in providing care and support, increase independence and to enable children with SEND to participate more fully in educational activities. Further co-production work with children, families and schools is planned over the next year.
Views of local people
There has been some recent local research to help develop a Transition protocols for schools in Kirklees (28). It aimed to gain clearer knowledge, and insight into the experiences of transition from the perspective of young people who have Special Educational Needs and Disability (SEND).
- It found in participants that often primary school was a relatively positive experience for them, whereas the move to high school was too big a move and somewhat traumatic.
- There were issues and anxieties in new schools of being late for classes, teachers shouting and too much homework.
The work also reinforced the need to work with and recognise individual needs when developing an individual transition plan, a plan that worked for them proved key to their sense of security within the school resulting in successful smooth transitions.
The research highlighted issues around transitioning from primary to high school, especially the short time scales used when pupils with SEND move school phases. Another common issue was the lack of (high school) teachers’ understanding of their needs as issues which caused them difficulties.
As part of the discussion with/around the experiences of students within a sixth form special school setting transitioning to college, the difficulties faced by families as a whole once their child left school was highlighted as a significant issue of concern. Exploring the impact that leaving compulsory education has on young people with SEND and their families would allow some insight to be gathered around specific issues. This could include issues such as health and well-being, accessing support services/ facilities and youth loneliness which was highlighted as an issue of growing concern particularly for vulnerable young people within the findings of the 2018 Kirklees Year 9 survey (29).
My Journey: The day-to-day experiences of young people with SEND.
A recent piece of local research (28) with children living with special educational needs and/ or disabilities reinforced that their lives feature the same concerns and aspirations of more able children. The research investigated daily routines, school life and leisure time, as well as longer term goals and views about adulthood.
The majority of the young people involved stated that they got ready in the morning independently. Many, not unlike their peers said their parents played an important caring role, particularly in relation to medication and physiotherapy.
On the whole the cohort felt that school had an inclusive approach to helping them achieve their potential. They felt that their schools made activities and learning accessible to all. They spoke of activities being customised and additional support staff helping where necessary.
When it came to after school activities those who were reliant on timed school transport found it harder to be involved, but older children were sometimes able to travel independently.
There were a group of children with hidden disabilities that felt that their peers were often unaware of their disabilities and how it impacted on their everyday lives which often made making and maintaining relationships with their peers difficult.
For most young people, they stated that their free time was taken up by playing on their consoles, iPads, smartphone or watching television. Many used Social Networking stating that virtual communication was an essential way of staying in touch with their peers. Many young people spoke passionately about caring for pets. They described the responsibility of making sure their pets were properly looked after and loved as something that brought much daily pleasure.
When they were asked about the future some young people reported feeling anxious and nervous about adult working life. They had career aspirations but, like many young people weren’t entirely sure whether they would realise their dream careers. They were also positive about finding and developing personal relationships, with some wanting to start families.

The Young People’s Survey 2019
A regular Young People’s Survey is carried out and the most recent one was conducted in 2019. It included a sample of over 3000 students in year 9 at mainstream schools across Kirklees.
Overall, 1 in 10 (10%) said they had a special educational need or learning difficulty. Of these, almost half (46%) did not feel that they had enough support from school.
Around 1 in 7 (15%) said that they had a health condition or disability which affects their day-to-day activities. Almost one third (31%) of these young people said they didn’t get adequate support from health services.
SEN students and those with a health condition that affects their everyday life are significantly more likely to have been bullied, both physically and in other ways. Over a third (37%) of SEN students have experienced physical bullying. In comparison, around one in six (17%) non-SEN students have experienced physical bullying.
Social Isolation
Young people with a SEN were significantly more likely to experience social isolation.
25% said that they often have no one to talk to compared with 12% of those without a SEN.
22% said that they often feel left out compared with 9% of those without a SEN.
27% said that they often feel alone compared with 11% of those without a SEN.
Health & Wellbeing
60% of those with a SEN reported their general health as ‘good’ or ‘very good’ compared with 75% of those without a SEN.
2 in 5 (40%) of those with a SEN reported that they ‘rarely’ or ‘never’ feel optimistic about the future compared to 1 in 5 (22%) without a SEN.
1 in 4 (25%) of those with a SEN reported that they ‘rarely’ or ‘never’ feel able to make up their own mind about things compared to around 1 in 10 (9%) without a SEN.
29% of those with a SEN reported a ‘high’ wellbeing (SWEMWBS) score compared with 48% of those with no SEN.
Parent and Carers interviews
As part of a series of interviews with families, the Care Quality Commission (30) asked a range of parents and carers what made a good service. Families and individuals outlined what is important to them:
- Ensuring that the right support is given.
- Approachable and available service.
- Good timeframe for appointments.
- That there are more specialists in each field who have a designated number of patients that they can effectively see regularly.
- It must take into account the specific needs of the family.
- Being treated as a client, not as them doing you a favour and you being a drain on resources.
- People listening and telling you what is available.
- Meeting all the needs of the family.
- Treating people with respect, listening to parents.
- Understanding of child’s special needs.
- Fewer hospital admissions.
- Assessments should be done early and there should be continuity of staff.
- Services talking to each other.
What could commissioners and service planners consider?
We can get better by……
- Improving the educational attainment and outcomes for children with SEND
- Reducing school exclusions for children with SEND
-
- Ensuring the voice of the child is heard consistently throughout our SEND activity developing a model of co-production with parents and families
- Assessing capacity in all settings and placements across our SEND system to meet individual needs
- Ensuring our assessments are carried out in a timely manner
- Ensuring that all of young people receive consistent, high quality and timely services
- Improving our assessment and provision for children and young people with Autism Spectrum Conditions and other neurodiverse conditions, such as dyspraxia
- Improving our provision for children and young people with Social, Emotional & Mental Health needs
- Improving our provision for children and young people with Speech, Language & Communication Needs
- Improving our provision for children and young people with a Specific Learning Disability
- Developing our Early Intervention – Our research into our cases show we could have intervened earlier (73%) to provide more early and timely support
-
- Improving the transitions from children to adult services across education, health and care services
- Improving the employment and education/training choices for post our post 16 teenagers and young people
- Having more local options and choices for young people across Kirklees which mean that young people don’t have leave Kirklees to live or for education.
References and additional resources/ links
Local authority interactive tool (LAIT)
- Langerman C, Worrall E. Ordinary Lives Disabled children and their families: A guide for donors and funders. 2005.
- Department for Education. Special educational needs in England: January 2019 [Internet]. 2019. Available from: https://assets.publishing.service.gov.uk/government/uploads/system/uploads/attachment_data/file/814244/SEN_2019_Text.docx.pdf
- Lenz B, Keith E, Sturomski NA, Corley MA. Serving Adults with Learning Disabilities: Implications for Effective Practice. [Internet]. 1998. Available from: http://files.eric.ed.gov/fulltext/ED430078.pdf
- Public Health Wales. Low Birth Weight Review of risk factors. 2014.
- Kirklees Council. Low birth weight by District Committee. 2016.
- Office for National Statistics. Stillbirth- Local Authority [Internet]. 2015. Available from: https://www.ons.gov.uk/peoplepopulationandcommunity/birthsdeathsandmarriages/livebirths/datasets/birthsummarytables
- Office for National Statistics. Full teenage Conception Statistics [Internet]. 2014. Available from: https://www.ons.gov.uk/peoplepopulationandcommunity/birthsdeathsandmarriages/conceptionandfertilityrates/datasets/conceptionstatisticsenglandandwalesreferencetables
- Ramsbotham LR. The Links between Speech , Language and Communication Needs and Social Disadvantage [Internet]. 2013. Available from: https://www.rcslt.org/governments/docs/all_party_parliamentary_group_on_slcn_inquiry_report
- NHS Birth data, ONS data 2019-2032, School Census 2020/21 and Pupil Projections up to 2030.
- Contact a family. Health services for disabled children and young people Introduction [Internet]. 2015. Available from: https://www.cafamily.org.uk/media/625497/health_services_for_disabled_children_and_young_people.pdf
- Department for Education. Schools, pupils and their characteristics: January 2021 [Internet]. Available from: https://www.gov.uk/government/statistics/schools-pupils-and-their-characteristics-january-2021
- Beresford B. The needs of disabled children and their families. [Internet]. Vol. 76, Social Care Research. 1996. Available from: http://www.ncbi.nlm.nih.gov/pubmed/23122443
- Kirklees Council, NHS Greater Huddersfield CCG, NHS North Kirklees CCG. Current Living in Kirklees Survey. 2016.
- NHS England. Wheelchair services: Operational Data Collection – Quarter 3 dataset (October – December 2019) [Internet]. 2019. Available from: https://www.england.nhs.uk/statistics/statistical-work-areas/national-wheelchair/publication-files/
- Kirklees Council. School Census January 2021.
- Blackburn CM, Spencer NJ, Read JM. Prevalence of childhood disability and the characteristics and circumstances of disabled children in the UK: secondary analysis of the Family Resources Survey. BMC Pediatr [Internet]. 2010 Apr 16 [cited 2017 Apr 21];10:21. Available from: http://www.ncbi.nlm.nih.gov/pubmed/20398346
- Kelly B, Dowling S, Winter K. Disabled Children and Young People who are Looked After: A Literature Review. Belfast; 2012.
- The National Autistic Society. What is Autism? [Internet]. Available from: http://www.autism.org.uk/about/what-is/asd.aspx
- Kirklees Council. Synergy current pupil recrods via the Council’s Tableau SEN Dashboard
- Kirklees Council. Neurological Conditions [Internet]. 2013. Available from: http://kjsa.kirklees.gov.uk/KJSA/specific-conditions/neurological-conditions
- Kirklees Council. Children and Young People’s Survey. 2014.
- Asthma UK. Quit smoking to manage your asthma better [Internet]. Available from: https://www.asthma.org.uk/advice/manage-your-asthma/quit-smoking/
- Asthma UK. Asthma and pregnancy [Internet]. Available from: https://www.asthma.org.uk/advice/manage-your-asthma/pregnancy/
- Joint Epilepsy Council. Epilepsy prevalence , incidence and other statistics. Joint Epilepsy Council of the UK and Ireland. 2011.
- Council for Disabled Children. Council for Disabled Children – Adulthood [Internet]. 2019. Available from: https://councilfordisabledchildren.org.uk/our-work/adulthood
- NHS. Moving from children’s social care to adult’s social care [Internet]. 2018. Available from: https://www.nhs.uk/conditions/social-care-and-support/transition-planning-disabled-young-people/
- Department for Communities and Local Government. The English Index of Multiple Deprivation ( IMD ) 2015 – Guidance What is the Index of Multiple Deprivation 2015 and how can I use it ? 2015;1–7.
- Kirklees Council. Young People with SEND Transition Experience Summary Report: Experiences of Transition from a young people with Special Educational Needs and Disability (SEND) perspective. 2019.
- Kirklees Council. Young People’s Survey 2018. 2018.
- Care Quality Commission. Health care for disabled children and young people: A review of how the health care needs of disabled children and young people are met by the commissioners and providers of health care in England. 2012.
- DfE Matrix via Knowledge Hub, 2019 and July 2021 merged
- Leicestershire Business Intelligence Team, Tableau/YorkshireandHumberSN-2021SEN2/EHCPnumbers, 2021
- DfE Statistical First Release, 2019 and 2020
Date this section was last reviewed
October 2021 (SH/SB)