 Clinical Commissioning Groups Summary
Headlines
|
|
|
|
|
|
 Starting well
 Developing well
 Living well
 Ageing well
 People and place
 What could commissioners consider?
Population
CCG areas
The North Kirklees and Greater Huddersfield CCG areas fit within the Kirklees Local Authority boundary. Kirklees itself is divided into 23 wards and four District Committee areas (Figure 1).
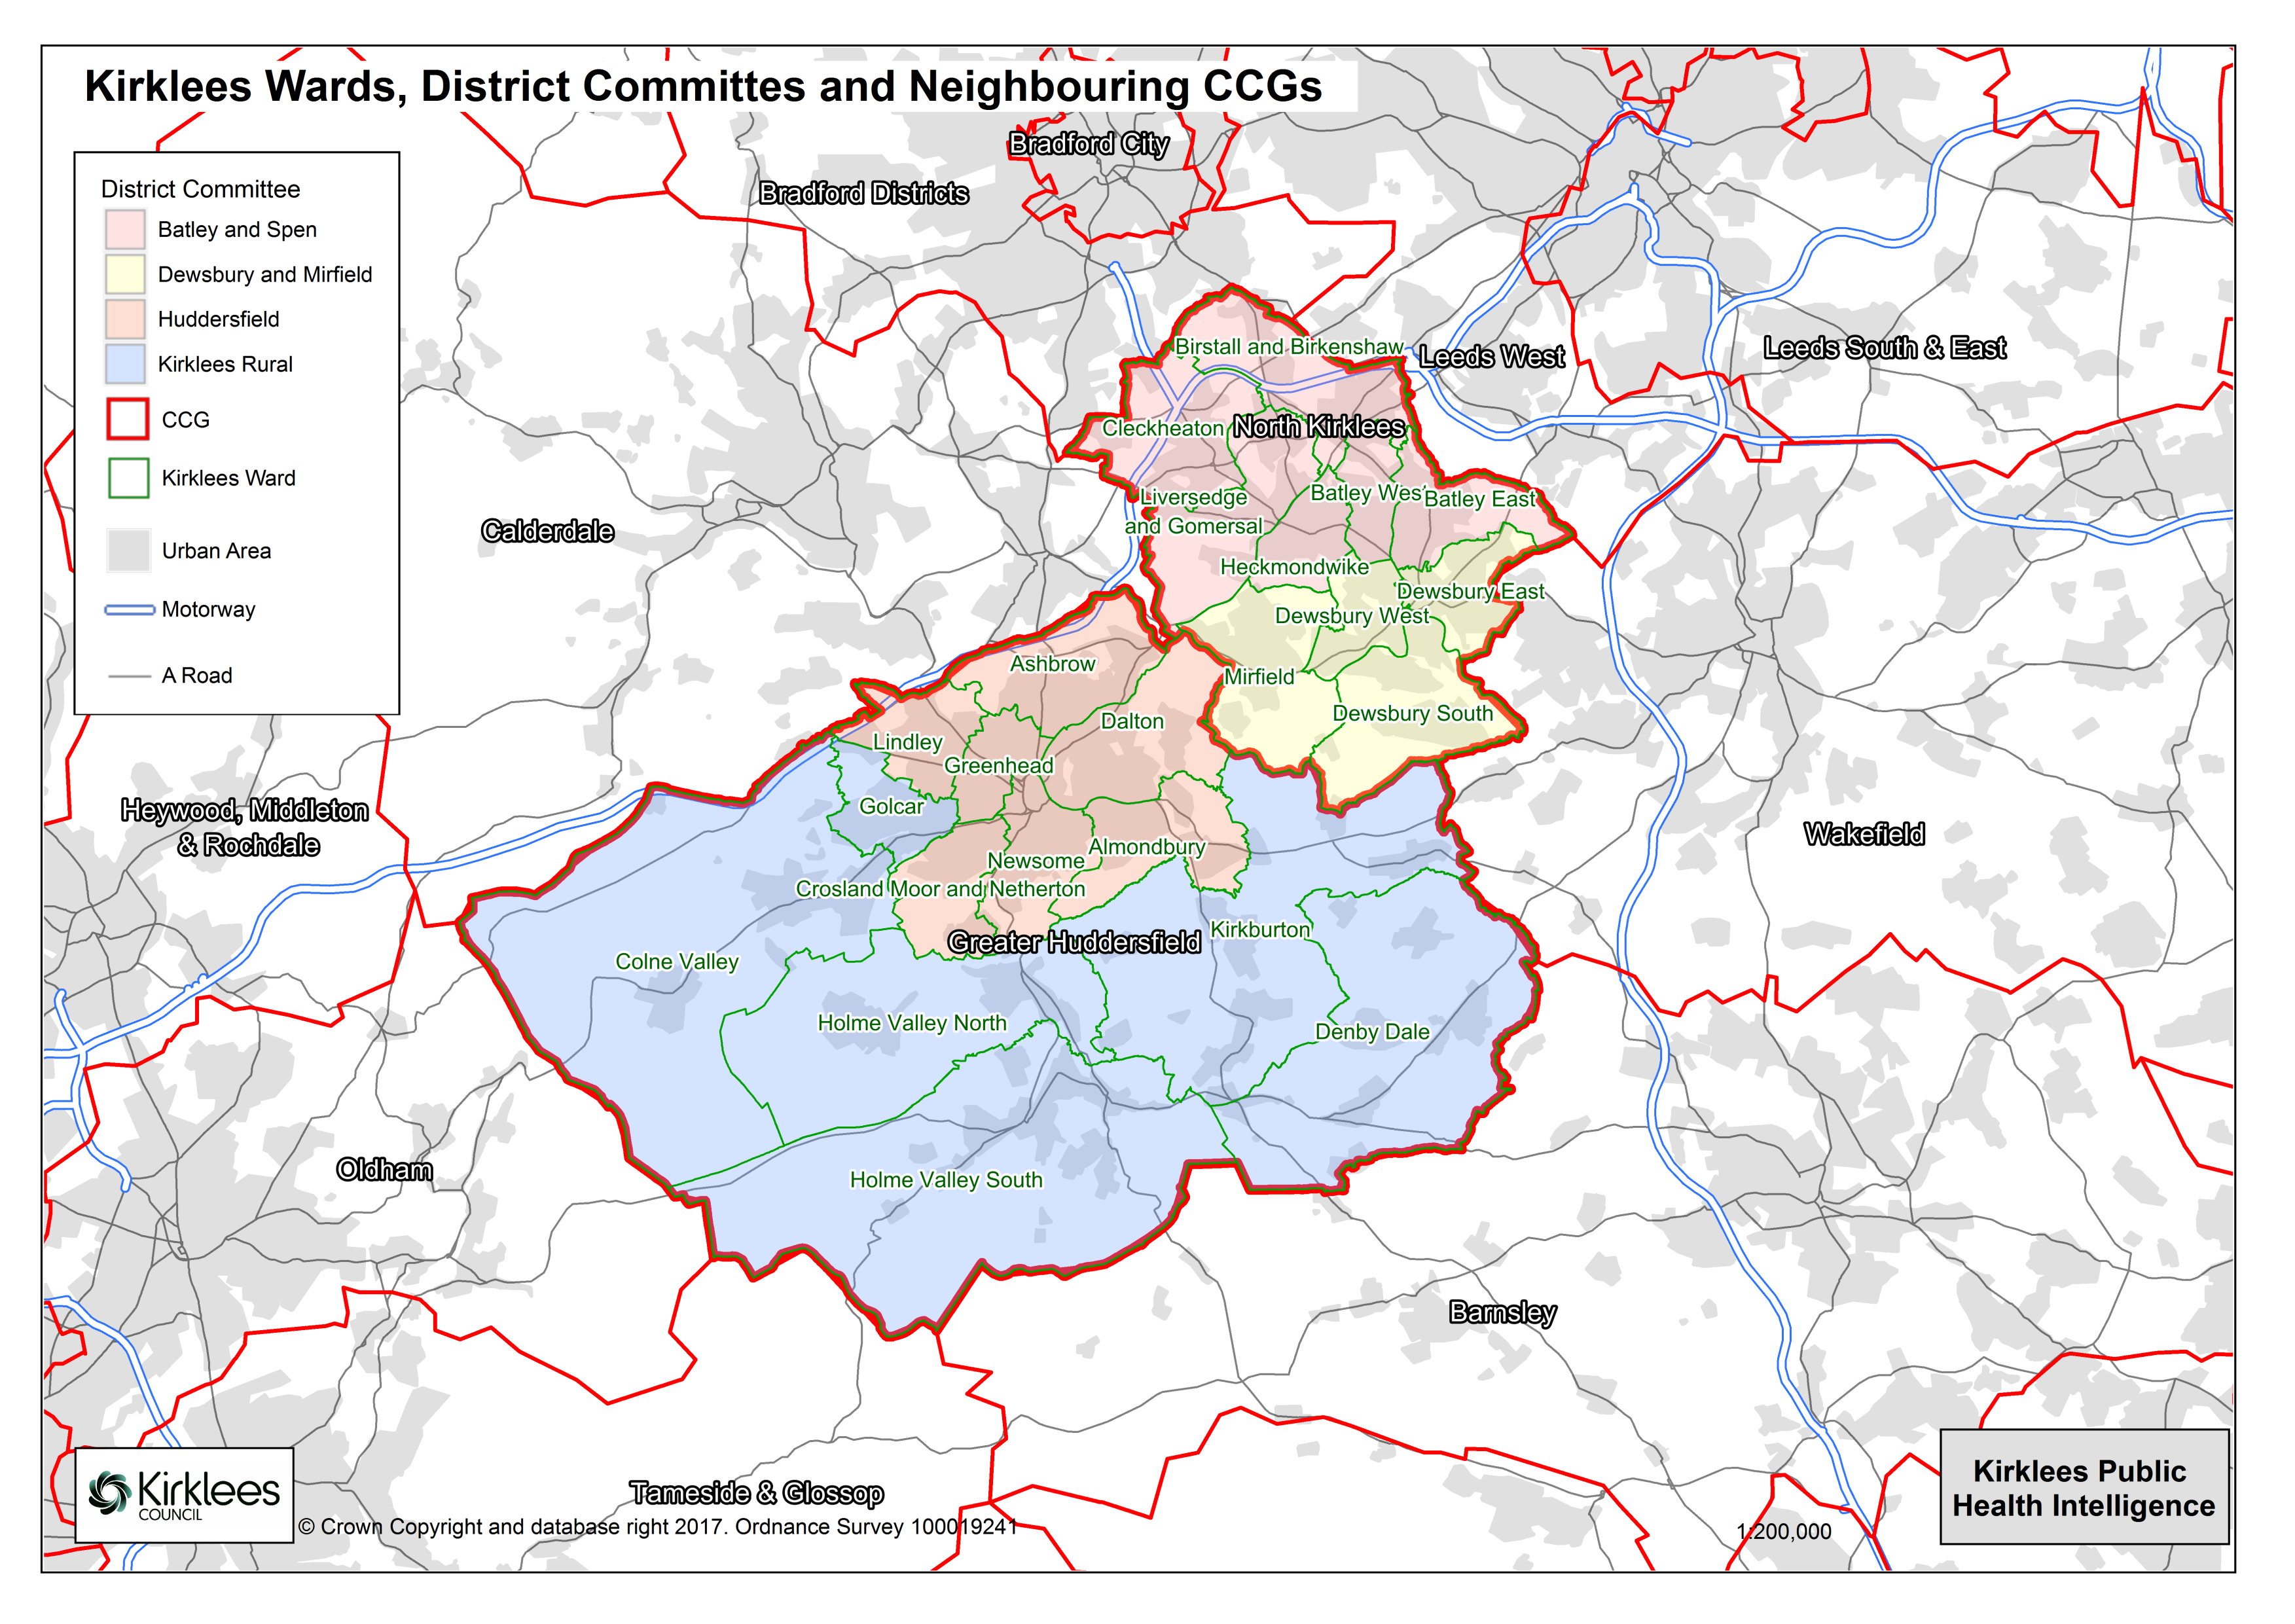 |
| Figure 1: Map of Kirklees CCGs, District Committees and wards |
The KJSA includes summaries for the four District Committees: Huddersfield and Kirklees Rural (covering Greater Huddersfield); Batley & Spen and Dewsbury & Mirfield (covering North Kirklees).
For additional information on each electoral ward, the following links provide a useful overview (requires Flash Player).
- Greater Huddersfield has 13 political wards: Almondbury, Ashbrow, Colne Valley, Crosland Moor and Netherton, Dalton, Denby Dale, Golcar, Greenhead, Holme Valley North, Holme Valley South, Kirkburton, Lindley and Newsome.
- North Kirklees has 10 political wards: Batley East, Batley West, Birstall & Birkenshaw, Cleckheaton, Dewsbury East, Dewsbury South, Dewsbury West, Heckmondwike, Liversedge & Gomersal and Mirfield.
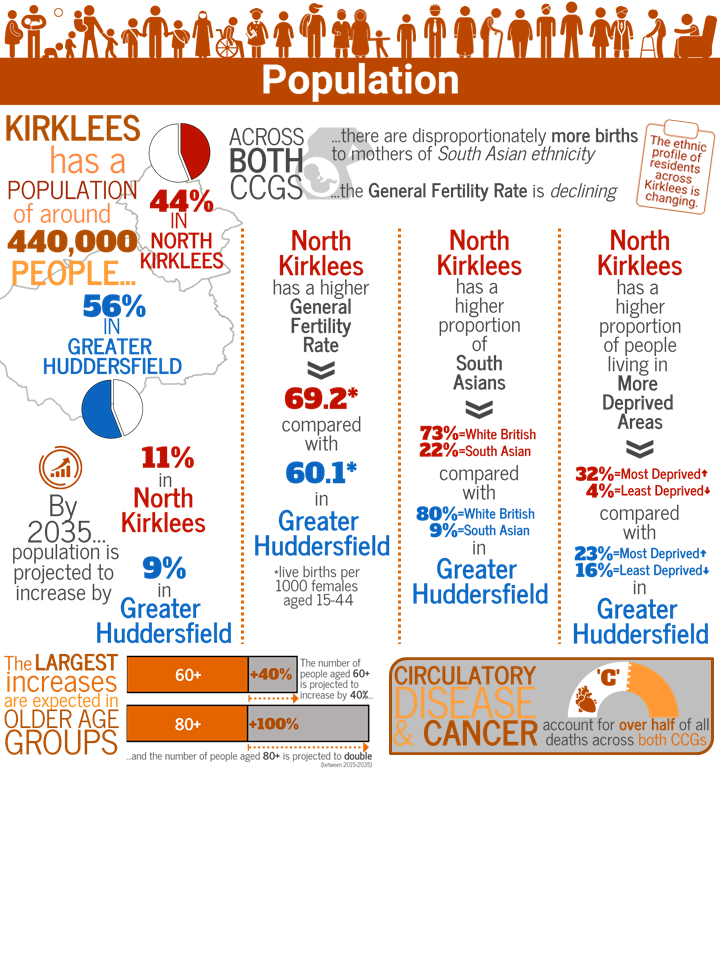
Population
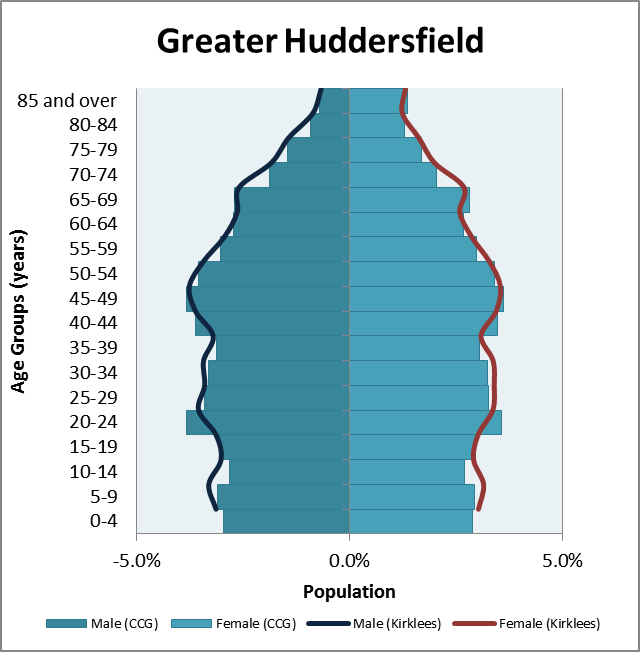
In total, 440,050 people are registered to a GP and resident in Kirklees (Jan 2015 GP population extract): 248,488 (56%) in Greater Huddersfield and 191,562 (44%) in North Kirklees. The population profile for each CCG by age and gender is shown in Figure 2, along with comparisons to the overall Kirklees profile.
 |
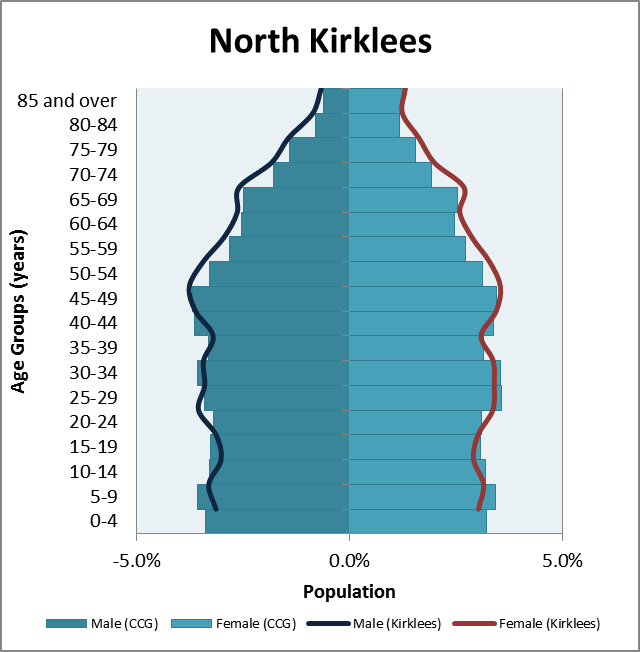 |
| Figure 2: % population in 5-year age bands (bars), with comparison to Kirklees (lines). Source: GP registered population, Jan 2015 extract | |
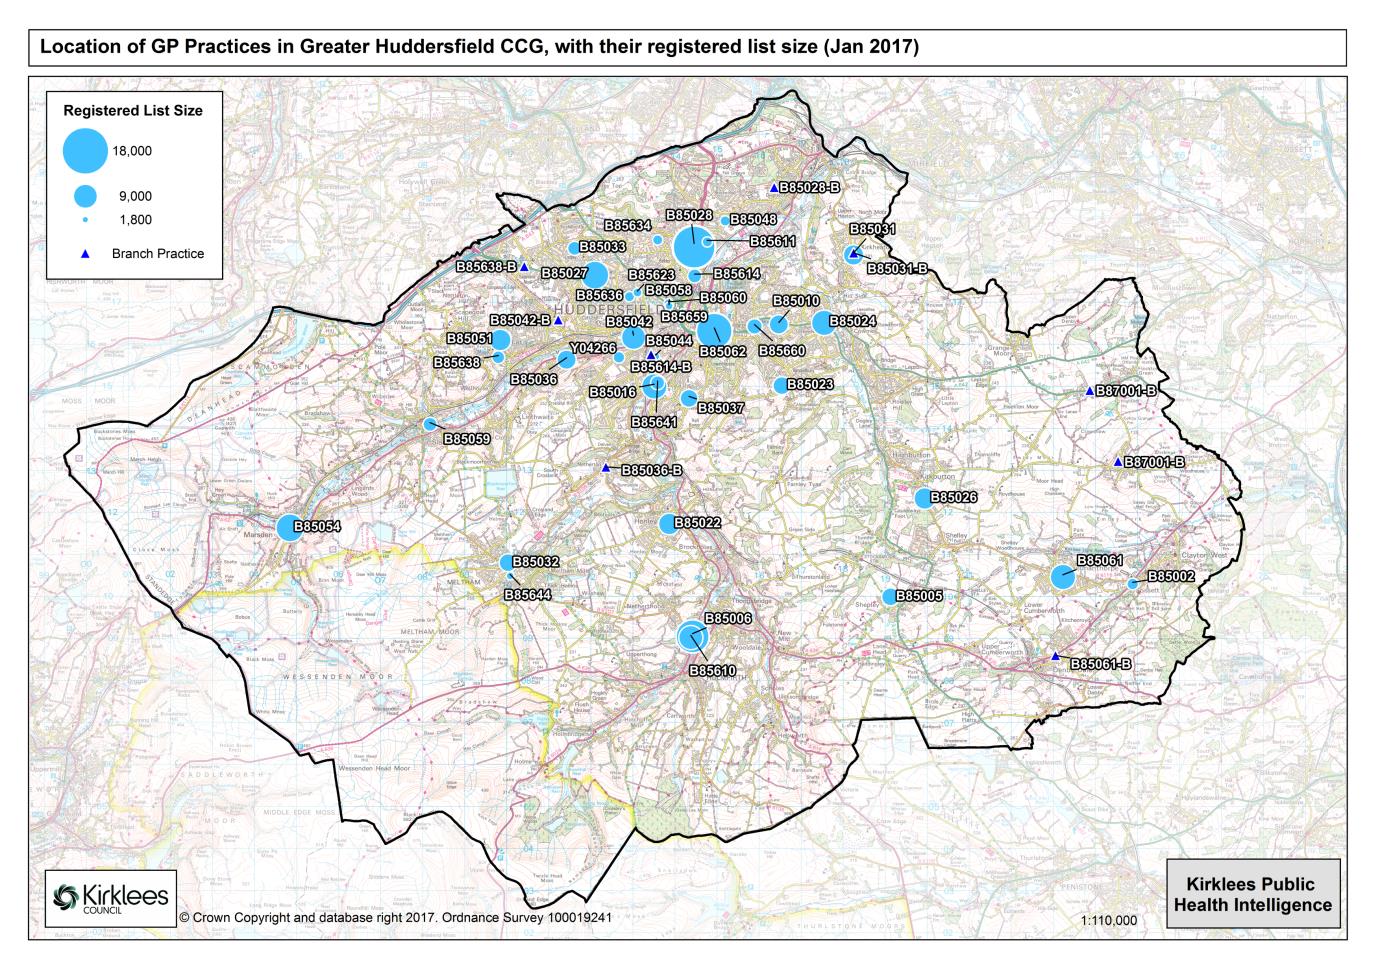
According to NHS Digital (Jan 2017 extract), there are 67 main GP practices across Kirklees:
- 38 practices in Greater Huddersfield, with a total list size of 246,133 patients;
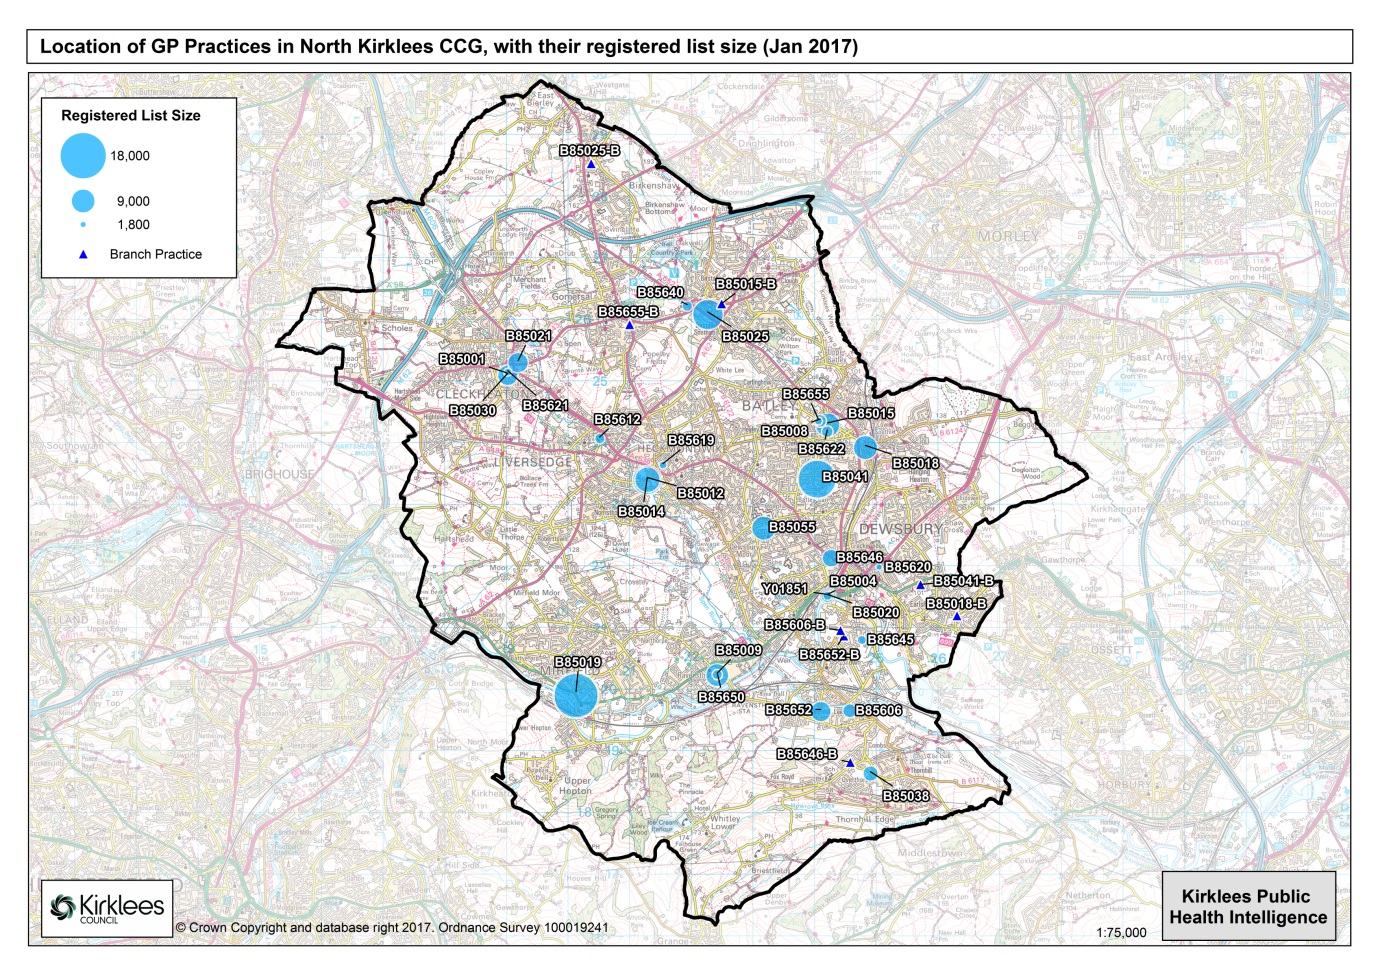
- 29 practices in North Kirklees, with a total list size of 191,909 patients.
These practices and list sizes are plotted in Figures 3 and 4, along with branch practice locations.
 |
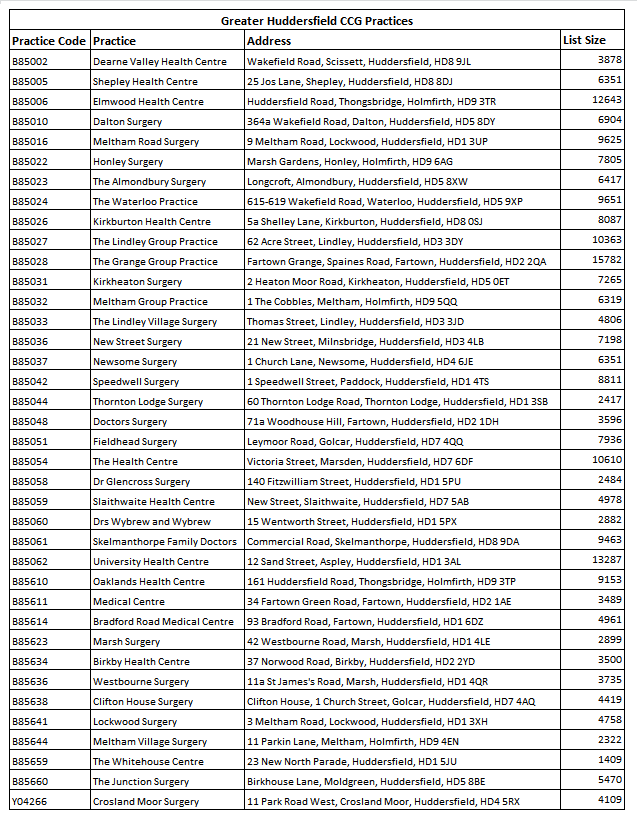 |
| Figure 3: Location and list size of each GP practice in Greater Huddersfield (Jan 2017 extract, NHS Digital (1)) |
 |
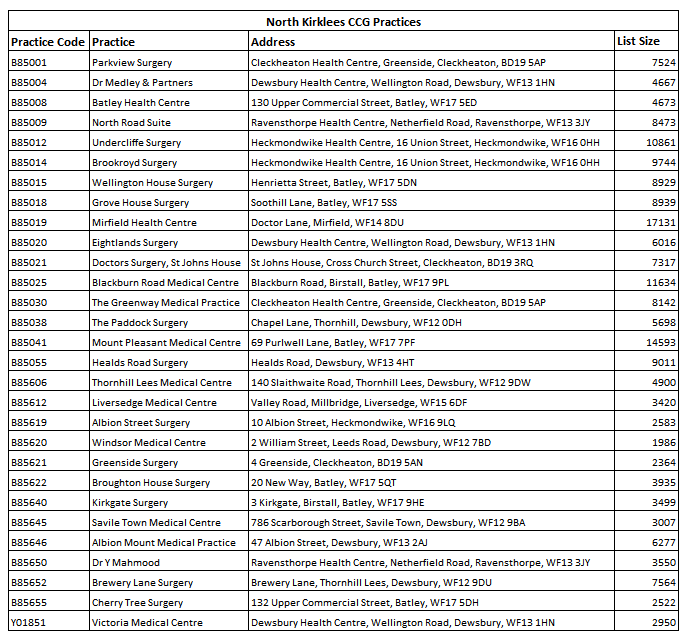 |
| Figure 4: Location and list size of each GP practice in North Kirklees (Jan 2017 extract, NHS Digital (1)) |
Ethnicity
According to the 2011 census, Greater Huddersfield has a larger proportion of people of White British ethnicity than North Kirklees (73% NK | 80% GH) and North Kirklees has a higher proportion of people of South Asian ethnicity (22% NK | 9% GH) (Figure 5).
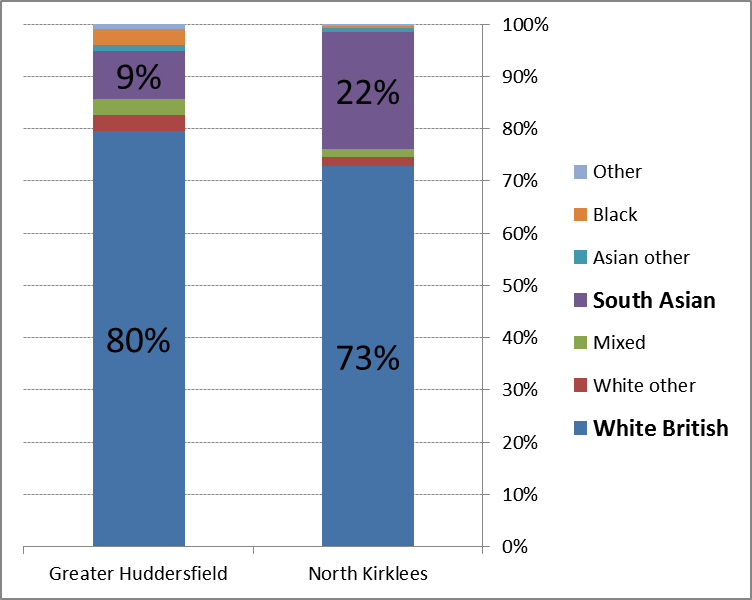 |
| Figure 5: % population by broad ethnic group (two largest groups labelled); Source: 2011 Census (ONS) |
The majority of asylum seekers coming to Kirklees are located in Greater Huddersfield, as are many of the emerging communities of Eastern European migrants, leading to a greater ethnic diversity in this area. Further details on the population distribution by ethnicity and information about the ethnicity of school children across Kirklees can be found in the KJSA population section.
Births
In 2015 there were 2,811 births in Greater Huddersfield (52% of Kirklees births, including seven stillbirths and 10 neonatal deaths) and 2,581 births in North Kirklees (48% of Kirklees births, including 10 stillbirths and 10 neonatal deaths). For 2013-15, the stillbirth rate was higher for North Kirklees than for Greater Huddersfield and England, but the difference was not significant (5.6 stillbirths per 1000 births NK | 4.3 GH | 4.6 England) (Data source: ONS).
The general fertility rate for North Kirklees residents is significantly higher than the rate for Greater Huddersfield (69.2 live births per 1000 females aged 15-44 in NK compared with 60.1 in GH). In recent years, the general fertility rate in both CCGs has declined (Figure 6).
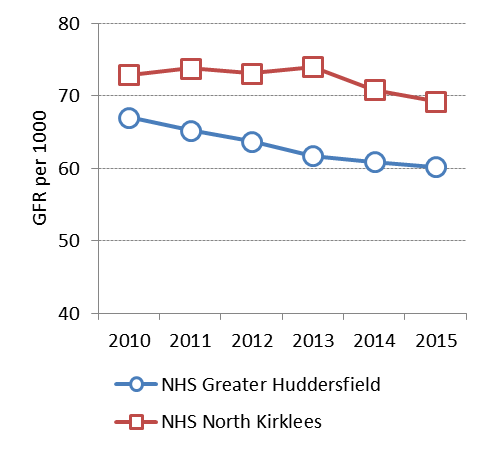 |
| Figure 6: General fertility rate by CCG (births per 1000 females aged 15-44); Source: Office for National Statistics (via PHE Pregnancy and birth profile) |
Table 1 shows the proportion of births for mothers resident in Kirklees grouped by mother’s ethnicity, using data provided by Mid-Yorkshire Hospitals Trust and Calderdale and Huddersfield Foundation Trust.
| Table 1: Mother’s ethnicity, births in 2016/17 (Kirklees residents); comparison with women age 18-44 from 2011 census (ONS)(2) |
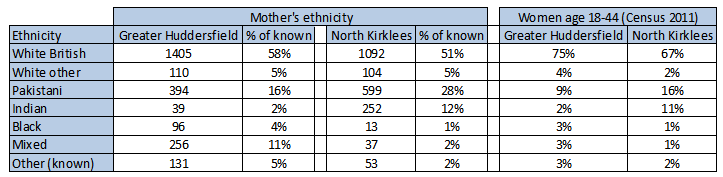 |
For Greater Huddersfield, there are disproportionately more births to mothers of mixed ethnicity (11% of births, compared with an overall population of 3%) and mothers of South Asian ethnicity (18% of births compared with 9% of the population and 11% of women aged 18-44). North Kirklees also has a higher proportion of births to mothers of South Asian ethnicity (40% of births, compared with 22% of the population and 27% of women aged 18-44). It is clear that the ethnic profile of residents across Kirklees is changing.
Deaths
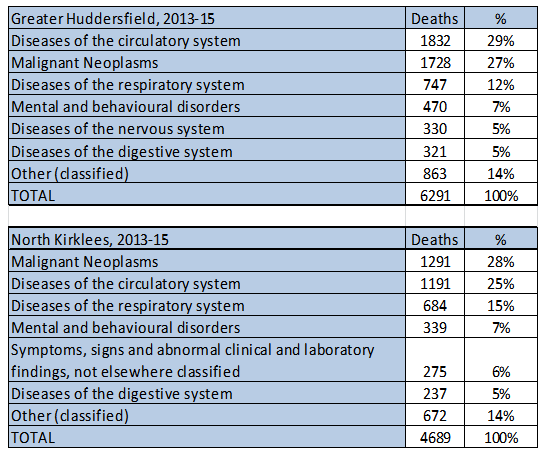
Between 2013 and 2015 a total of 11,040 Kirklees residents died; 6,316 (57%) from Greater Huddersfield and 4,724 (43%) from North Kirklees (Source: Primary Care Mortality Database, PCMD).
Circulatory disease and malignant neoplasms account for over half of all deaths in both CCGs (53% NK | 57% GH); Greater Huddersfield has a higher proportion of deaths from circulatory disease (25% NK | 29% GH).
| Table 2: Most common causes of death, 2013-15 (PCMD) |
 |
The all-cause all-age directly standardised mortality rate (2013-15) is slightly higher in North Kirklees compared with Greater Huddersfield (10.5 NK | 10.0 GH deaths per 1000 population), as is the under-75 all-cause mortality rate (3.6 NK | 3.3 GH), but neither difference is significant. All-cause mortality rates are significantly higher for males than females across both CCGs.
Under-75 directly standardised mortality rates (2013-15) for four of the most common causes of death are shown in Table 3.
| Table 3: Under-75 directly standardised mortality rates per 100,000 people, by CCG |
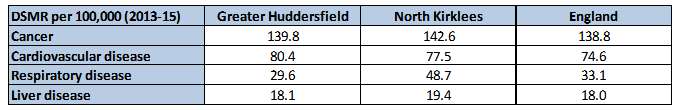 England values from Public Health Outcomes Framework (3) |
Further details on deaths in Kirklees can be found in the KJSA population section.
Deprivation
Using the Index of Multiple Deprivation (IMD) 2015 (4), North Kirklees has a higher proportion of people living in more deprived areas than Greater Huddersfield (Figure 7). In North Kirklees, three in five people live in areas ranked as amongst the most deprived 40% of areas in England, with only one in four people living in the least deprived 40% of areas. In Greater Huddersfield, the figures are closer to the national distribution, with two in five living in areas ranked as amongst the most deprived 40% of areas in England and two in five living in the least deprived 40%. The proportion of people living in the least deprived quintile in Greater Huddersfield (16%) is four times greater than that in North Kirklees (4%)
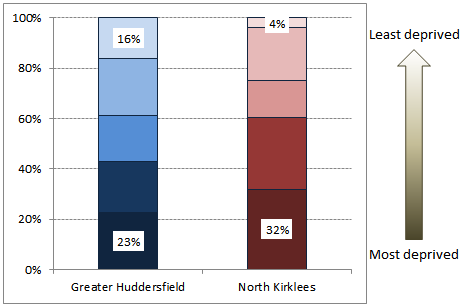 |
| Figure 7: Proportion of population living in each deprivation quintile (Jan 2015 GP registered population extract; IMD 2015 |
Further details on the population distribution by IMD quintile can be found in the KJSA population section.
Protected characteristics
The Equality Act 2010 was created to consolidate current legislation around discrimination. The Act defines nine protected population characteristics that must be considered when striving for equality. Data are available at CCG level for some of these protected characteristic groups, including the demographic splits by age, sex and ethnicity already covered above and the additional three listed below.
Religion: According to the 2016 CLiK population survey (5), a significantly higher proportion of adults in North Kirklees are Muslim (20% NK | 6% GH) and a significantly higher proportion of adults in Greater Huddersfield declared no religion (22% NK | 33% GH).
Sexuality: According to the CLiK survey (5), the proportion of lesbian/gay/bisexual adults was similar across both CCGs.
Disability: A higher proportion of adults in North Kirklees have a physical or mental health condition which has lasted or is expected to last 12 months or more and reduces their ability to carry out day-to-day activities a lot (13.9% NK | 11.7% GH) (5). Applying these percentages to the 2015 adult populations of both CCGs, this would equate to around 20,200 adults in North Kirklees and 23,000 adults in Greater Huddersfield. Further information at Kirklees level can be found in the KJSA section on disabled people.
A general overview of these and other protected characteristic groups in Kirklees can be found in the KJSA population section. The pregnancy and maternal health section covers women with these protected characteristics.
The inequalities section of the KJSA explores the extent to which health-related outcomes of people in protected characteristic groups may be affected.
Life expectancy
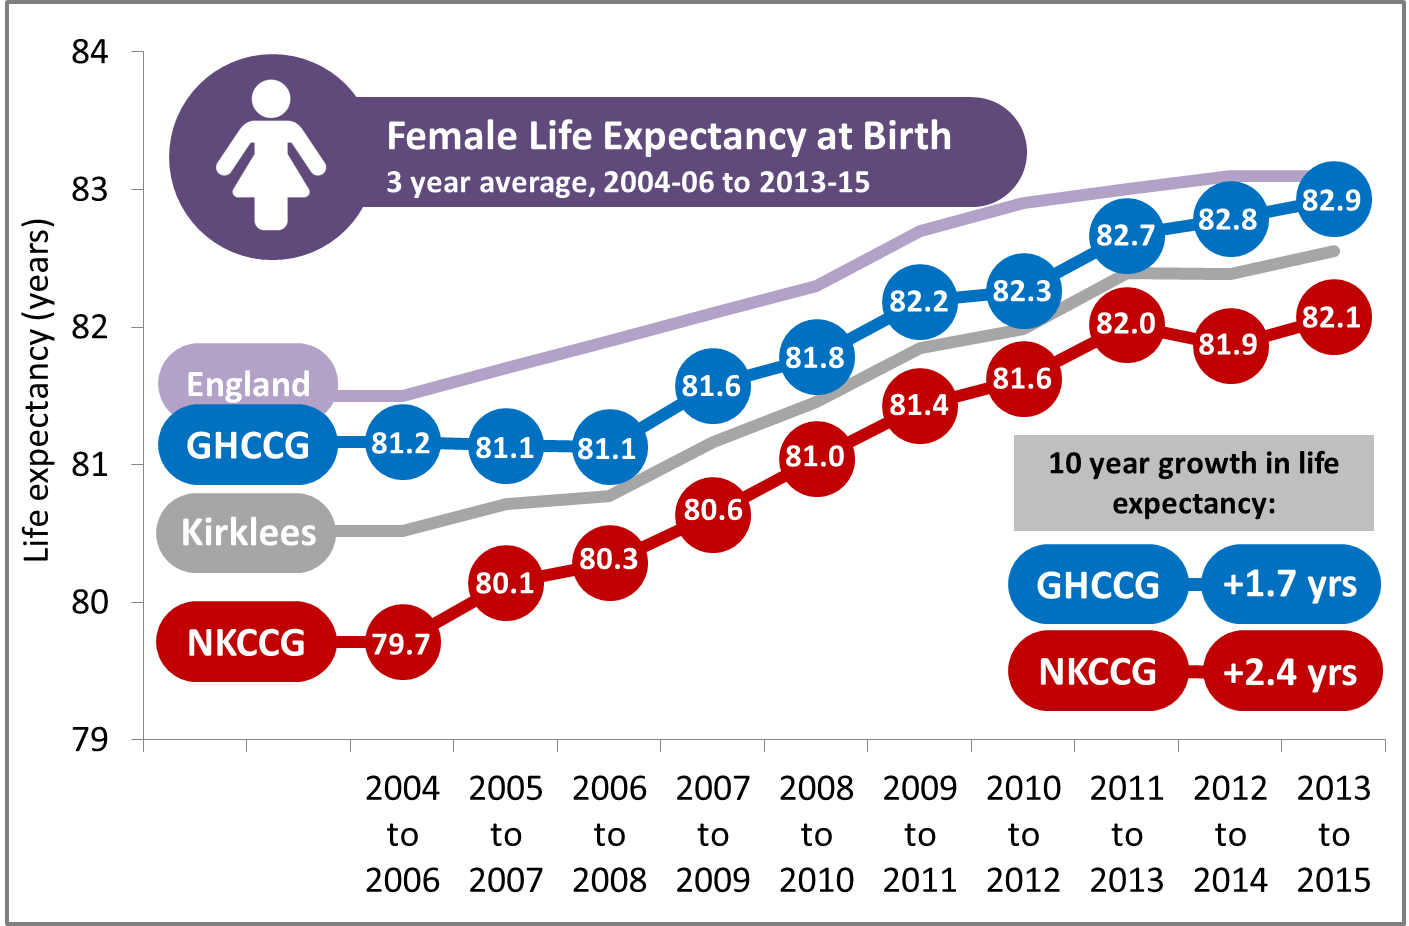
Life expectancy at birth is slightly higher for residents of Greater Huddersfield than North Kirklees for males (79.0 years NK | 79.7 GH) and females (82.1 years NK | 82.9 GH), although the differences between the two areas are not significant. Variations in life expectancy for each CCG over the last 10 years are shown in Figure 8.
 |
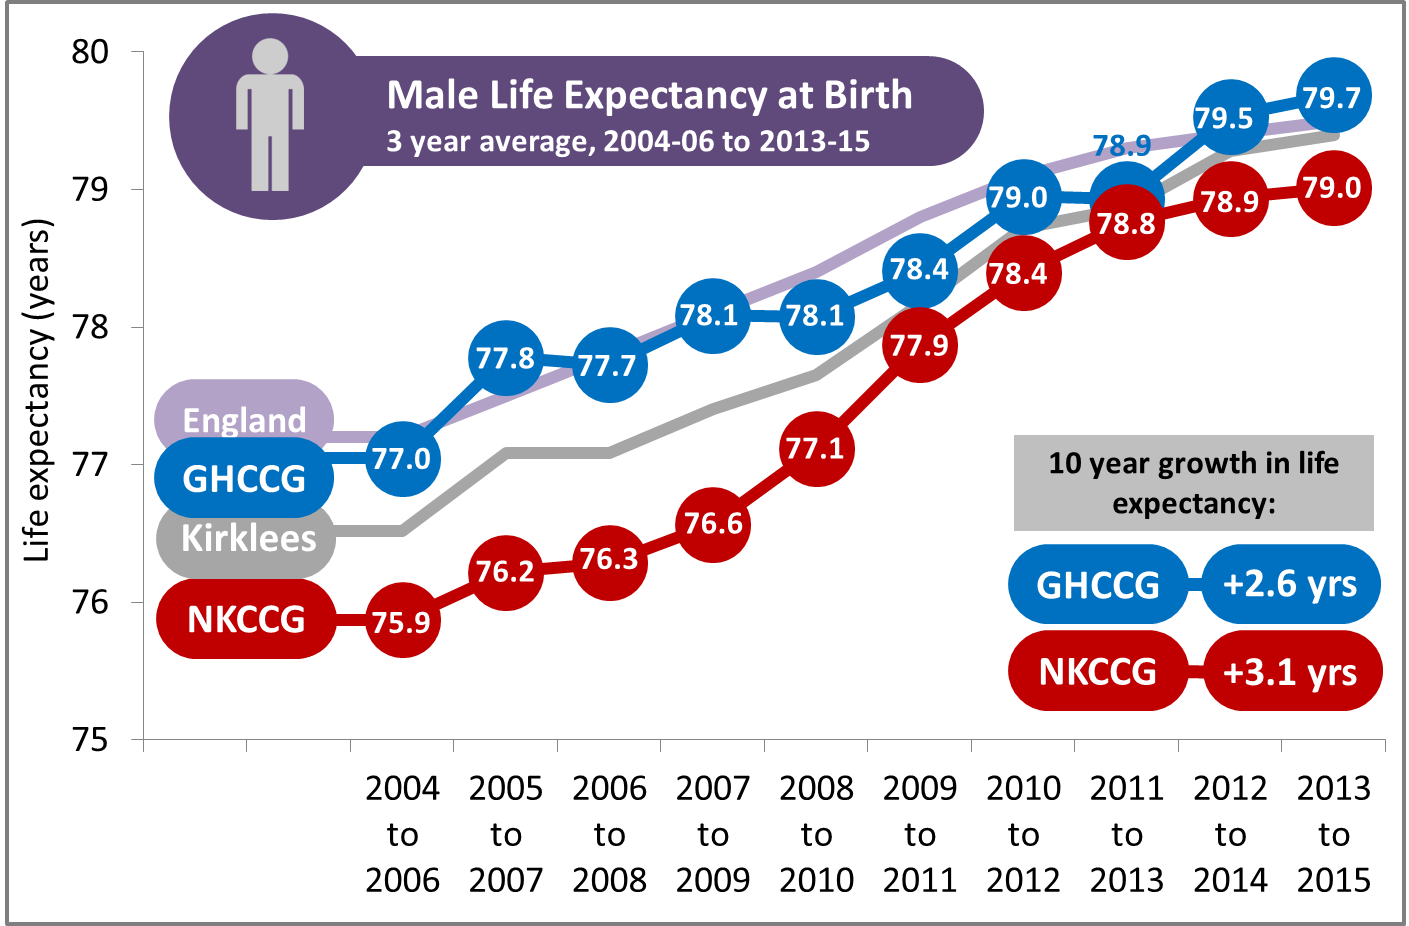 |
| Figure 8: Changes in female and male life expectancy between 2004-06 and 2013-15 by CCG (Data sources: Primary Care Mortality Database; mid-year GP registered populations) |
Further details on life expectancy and healthy life expectancy across Kirklees can be found in the KJSA population section.
Population projections
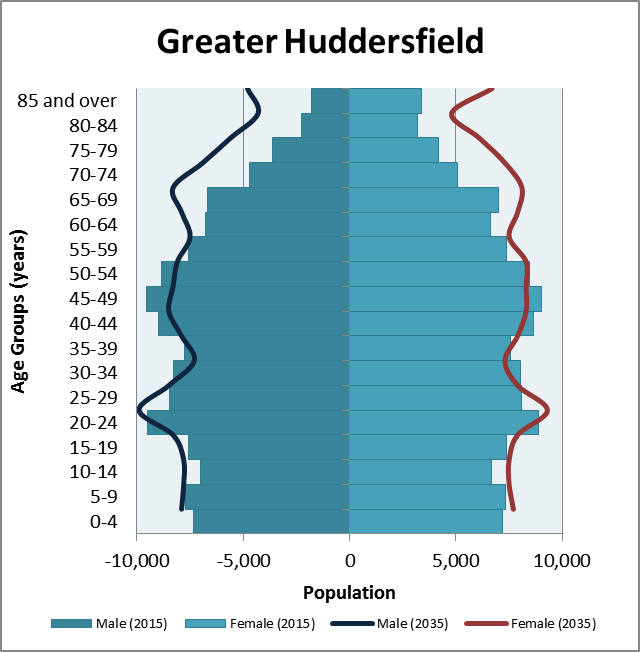
By 2035, the population of Greater Huddersfield is projected to increase to 271,900 (+9% compared with 2015) and North Kirklees is projected to increase to 212,500 (+11%) (ONS projections, 2014 base (6)). Figure 9 shows this change by age and gender, with the largest increases clearly seen in the older population. Projected changes equate to an increase of more than 40% in the number of people aged 60+ for both CCGs. The number of people aged 80+ is expected to double between 2015 and 2035.
 |
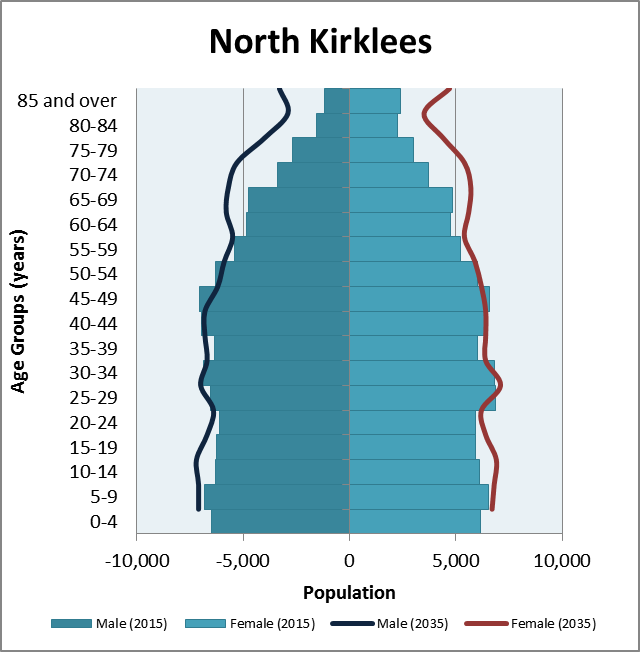 |
| Figure 9: Population counts in 5-year age bands for 2015 (bars), with comparison to 2035 projection (lines). Source: GP registered population (Jan 2015 extract); ONS population projections (2014 base)(6) | |
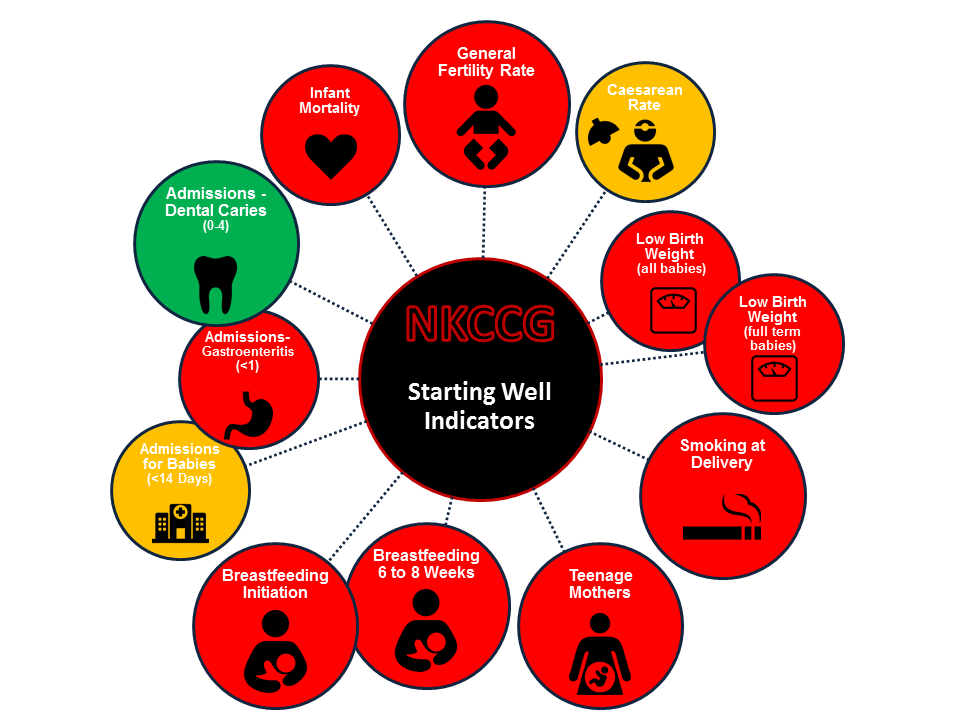
Starting well
 |
|
 |
|
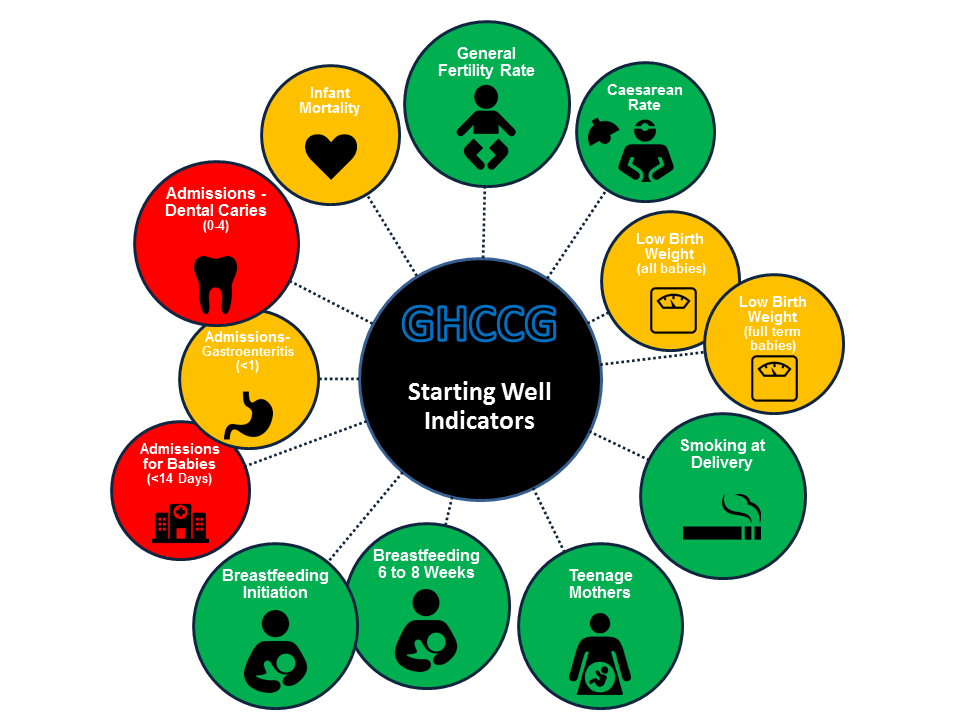
| Key: Red = Higher than England (Except for Breastfeeding where red is lower) Amber = Similar to England Green = Lower than England (Except for Breastfeeding where green is higher) Larger circle represents larger difference between CCGs |
Many factors contribute to improving and maintaining the health and emotional wellbeing of children, from maternal health pre-conception and through pregnancy to home, local communities and schools. In this section, we look at some key Starting and Developing Well indicators for Greater Huddersfield and North Kirklees CCG areas.
In 2015, the general fertility rate (live births per 1000 females aged 15-44) was significantly higher in North Kirklees than nationally whereas Greater Huddersfield was significantly lower (69.2 NK | 60.1 GH | 62.5 nationally). (5) (7)
Caesarean sections are often required for a number of maternal and infant reasons. By their very nature (i.e. they are used when there are complications) they are likely to be associated with an increased risk of problems. The 2015/16 national rate of caesarean section was 26.7%. North Kirklees had a similar rate whereas the rate in Greater Huddersfield was significantly lower (27.2% NK | 24.4 % GH). (8)
Low birth weight reflects the health of mothers and babies and is associated with poor outcomes for babies including increased infant mortality. In 2015, the total number of babies (including those born prematurely) born with low birth weight (less than 2500g) in Greater Huddersfield was similar to nationally. Whereas, the rate in North Kirklees was the worst in Yorkshire and the Humber and significantly worse than nationally (9.5% NK | 7.6% GH | 7.4% nationally). These comparisons have remained consistent since 2010. The 2015 national proportion of full term babies born with low birth weight was 2.8%.(8) In 2016/17(9), the rate in Greater Huddersfield was similar to nationally but the rate in North Kirklees was significantly higher (4.1% NK | 3% GH). (9)
Smoking in pregnancy has detrimental effects for the growth and development of the baby and health of the mother. It can cause serious pregnancy-related health problems. These include complications during labour and an increased risk of miscarriage, premature birth, stillbirth, low birth-weight and sudden unexpected death in infancy. Younger mothers are more likely to smoke during pregnancy; in 2015/16 around three in 10 mothers under 20 (28.8%) were smokers when their babies were born in comparison with one in 10 (9%) mothers aged 30 and over. Mothers of White ethnicity were more than seven times more likely to smoke than South Asian mothers in 2015/16. In 2015/16, around one in 10 (10.6%) mothers in England was a smoker at the time of delivery. In 2016/17 the rate in Greater Huddersfield was significantly lower than nationally, whereas in North Kirklees the rate was significantly higher than nationally, (15% NK | 9% GH) (10). Excluding South Asian mothers, amongst whom smoking prevalence is very low, this proportion increases to around one in four (24%). (10)
Children born to teenage mothers have higher rates of infant mortality and are at increased risk of low birthweight which impacts on the child’s long-term health. The rate of under-18 conceptions in Kirklees has generally been declining at a similar rate to nationally since 1998. Alongside an increase in the rate of under-18 terminations, the proportion of babies born to teenage mothers has also fallen:
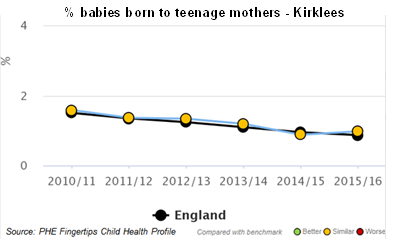
In 2015/16, Greater Huddersfield had a significantly lower proportion of babies born to teenage mothers (0.5%) than nationally (0.9%) and has the lowest rate in Yorkshire and the Humber. North Kirklees had a significantly higher proportion than nationally (1.5%). (8)
Breastfeeding is a key indicator of child health and wellbeing as it has some of the most wide-reaching and long-lasting effects on development. Current national and international guidance recommends exclusive breastfeeding for the first six months of infancy.
The proportion of mothers who initiated breastfeeding in 2014/15 nationally was around three in four (74.3%).(8) In Greater Huddersfield in 2016/17, the rate was significantly higher, with around eight out of 10 (77.9%) initiating breastfeeding. In North Kirklees, the rate was significantly lower; around two-thirds (66.1%) initiated breastfeeding.(11) The 2014/15 national rate of any breastfeeding at six to eight weeks was 43.8%. In 2016/17, in Greater Huddersfield the proportion was significantly higher at around five out of 10 (47.2%). In North Kirklees, it was around four out of 10 (38.1%) (12), which is significantly less than nationally. However, work needs to be done to ensure that submitted local data can pass the validation tests, and subsequently reported by the national mechanisms.
High levels of admissions of either mother or babies soon after birth can suggest problems with either the timing or quality of health assessments before the initial transfer or with the postnatal care once the mother is home. Dehydration and jaundice are two common reasons for re-admission of babies and are often linked to problems with feeding. In 2015/16, the rate of babies aged under 14 day olds admitted to hospital was significantly higher in Greater Huddersfield than nationally (79.1 compared with 66.9 per 1000). In North Kirklees, the proportion was similar to nationally (64.3 per 1000).(13)
Levels of childhood gastroenteritis can be reduced through increasing breastfeeding rates as well as improving diet and hygiene. The 2015/16 rate of admissions for gastroenteritis for babies under one year was 150.7 per 100,000 nationally. The rate for Greater Huddersfield was similar to nationally whereas the rate for North Kirklees was significantly higher (218.3 per 100,000 NK | 184.8 per 100,000 GH). (13)
In Greater Huddersfield in 2013/14-2015/16, the proportion of 0-4 year olds admitted to hospital for dental caries was more than three times higher than nationally. In North Kirklees, the rate was significantly better than nationally (131.4 per 100,000 NK | 836.3 per 100,000 GH | 247.9 per 100,000 nationally) .(13)
Infant mortality is an indicator of the general health of an entire population. It reflects the relationship between causes of infant mortality and upstream determinants of population health such as economic, social and environmental conditions. The rate of infant mortality overall in Kirklees has generally been declining, although North Kirklees saw an increase in 2013-15:
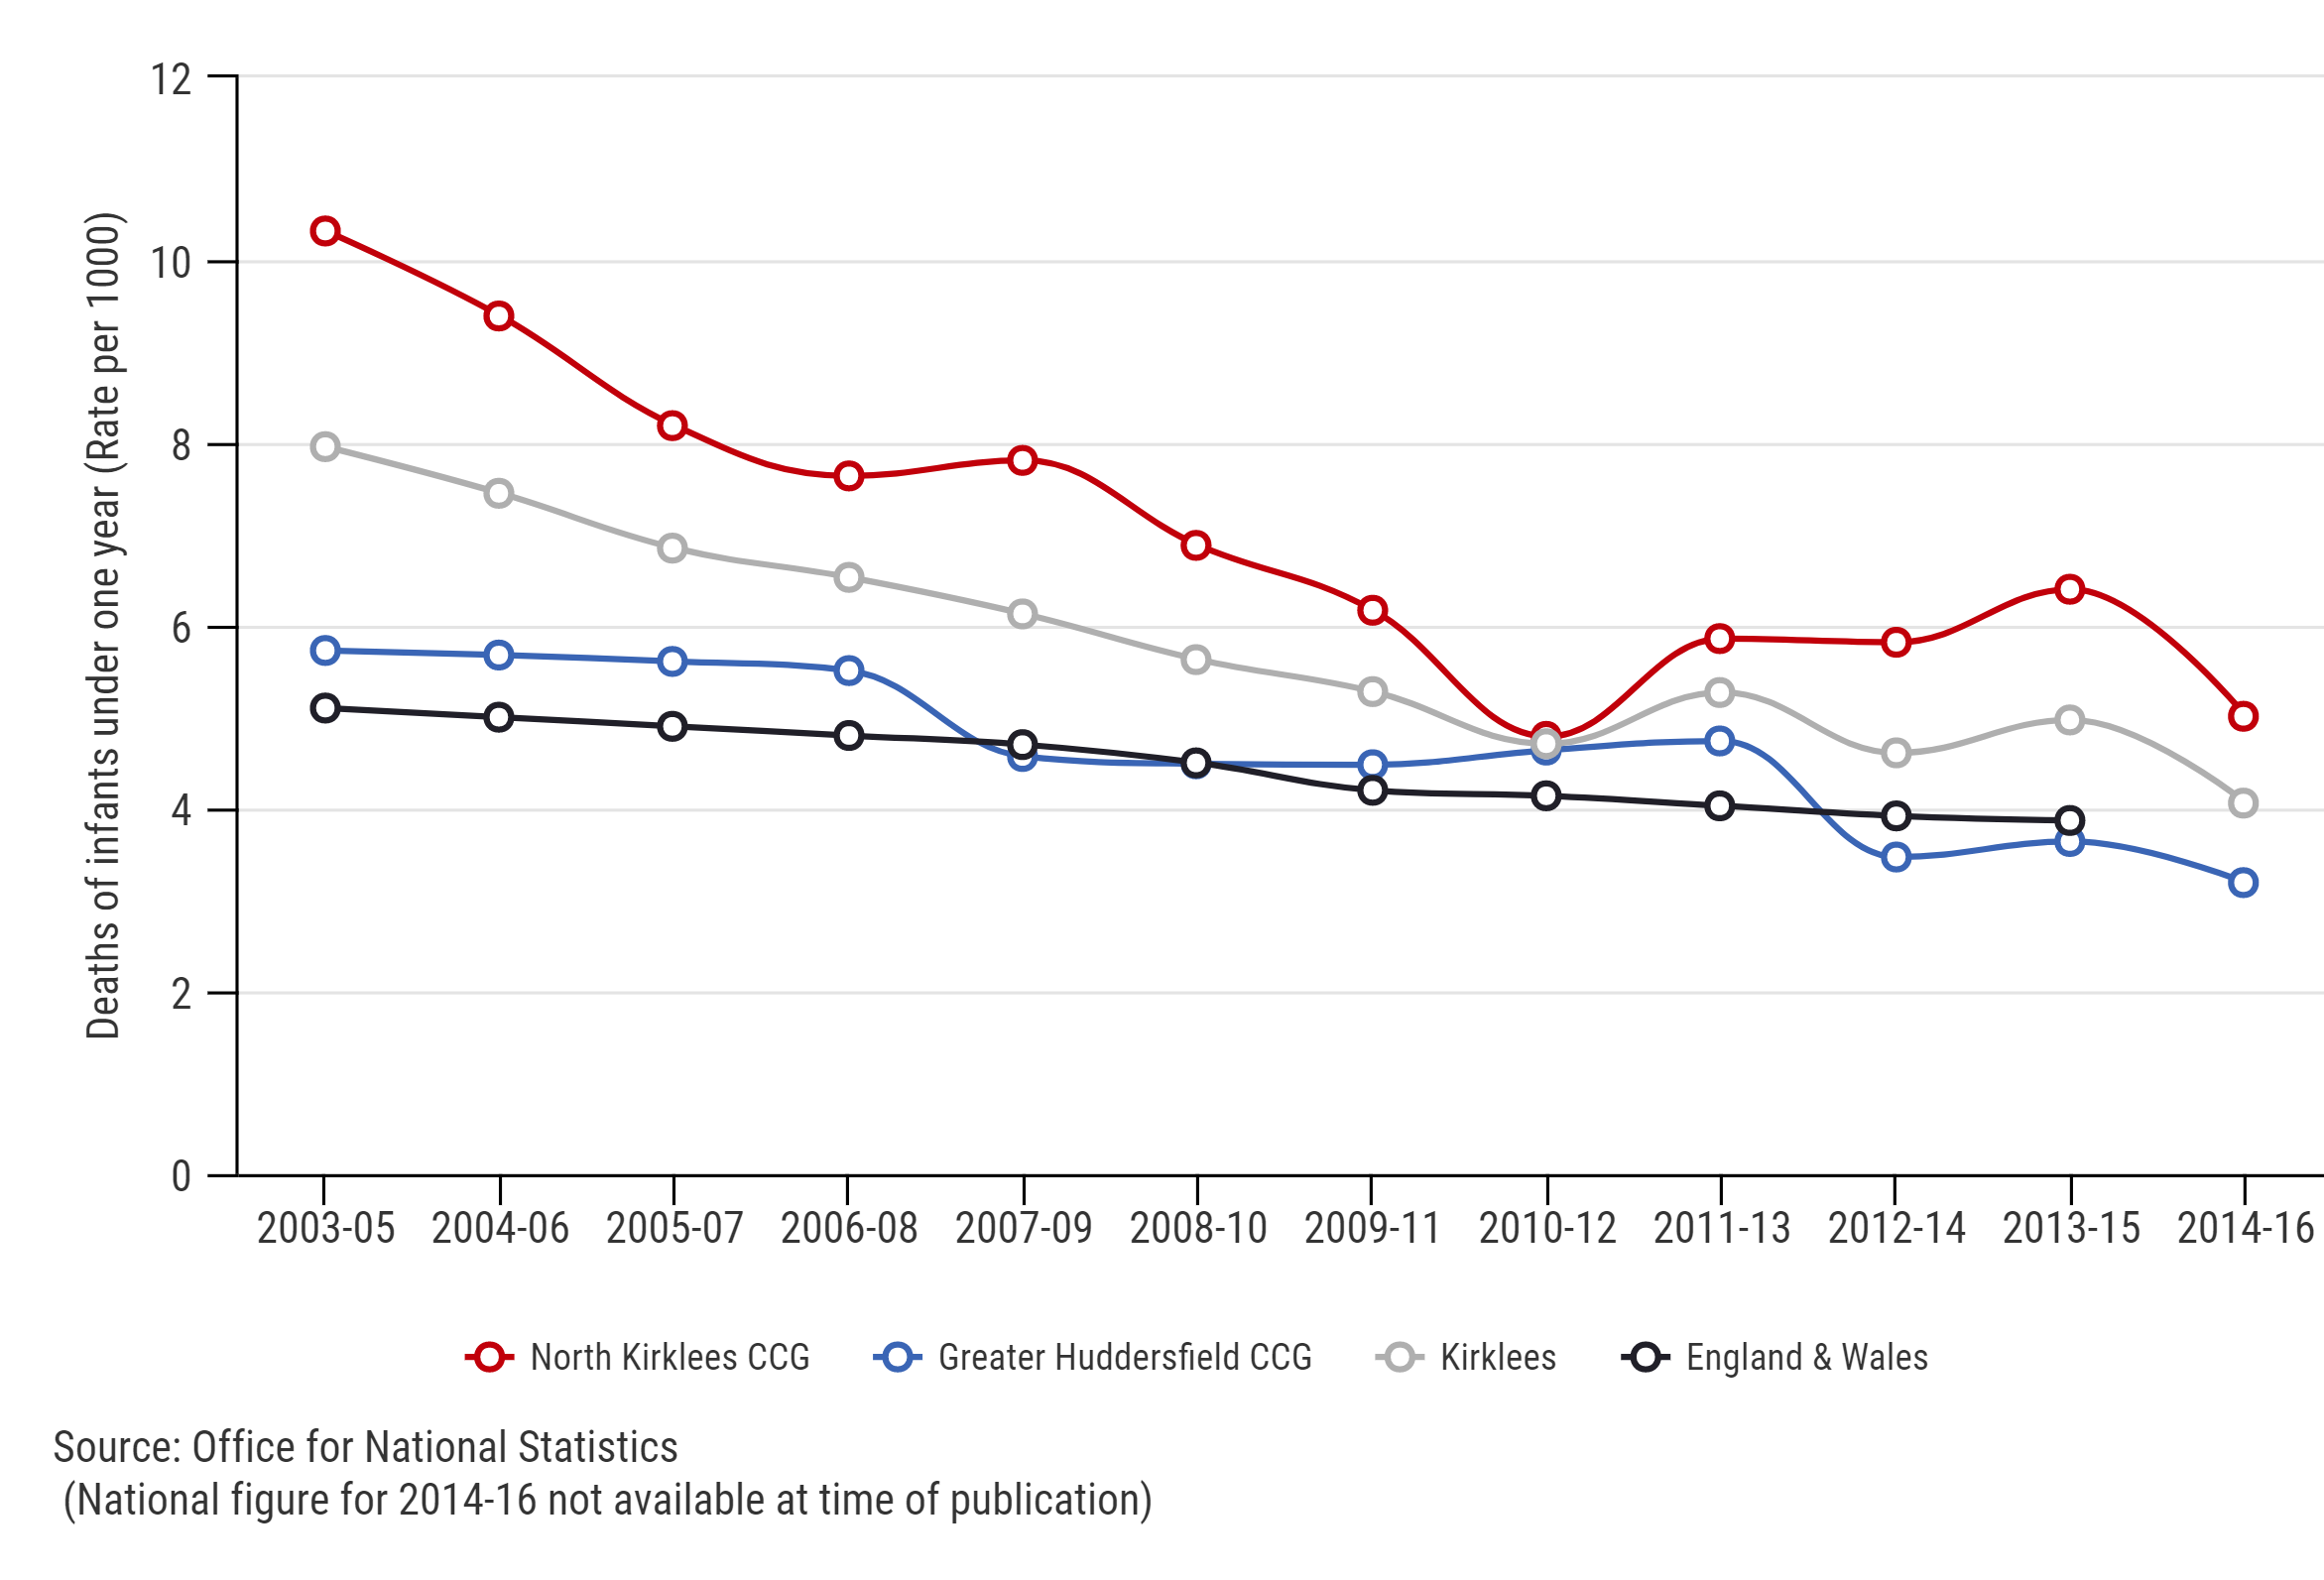
The three year rolling figures for 2013-15 show that the infant mortality rate in Greater Huddersfield (3.7 per 1000 live births) is similar to nationally (3.9 per 1000 live births). In North Kirklees this rate was significantly higher than nationally (6.5 per 1000 live births) and the highest rate regionally. (13)
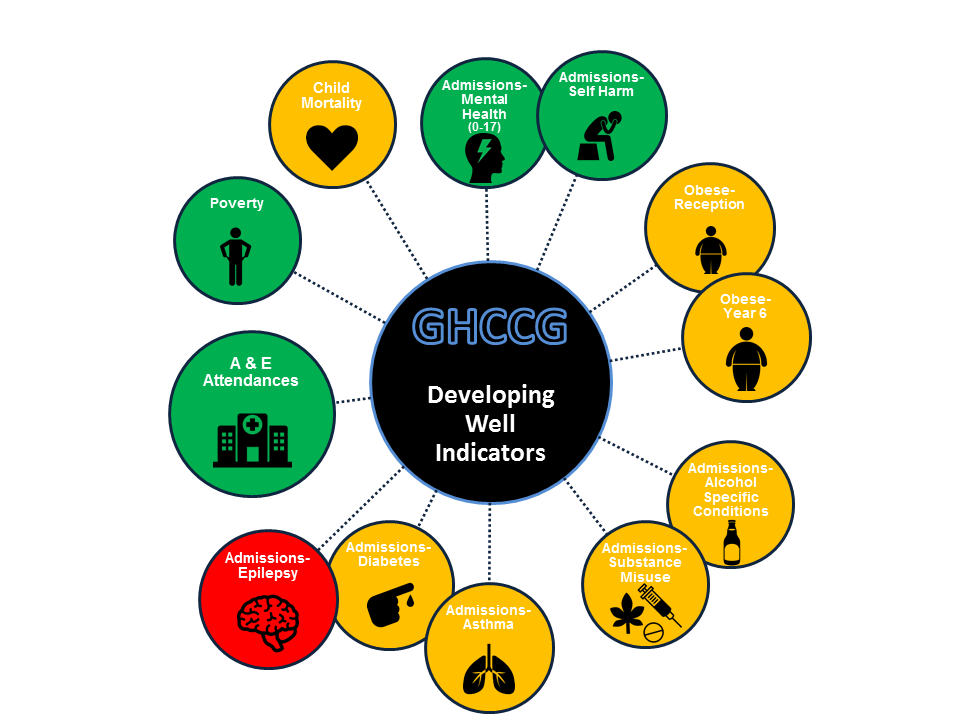
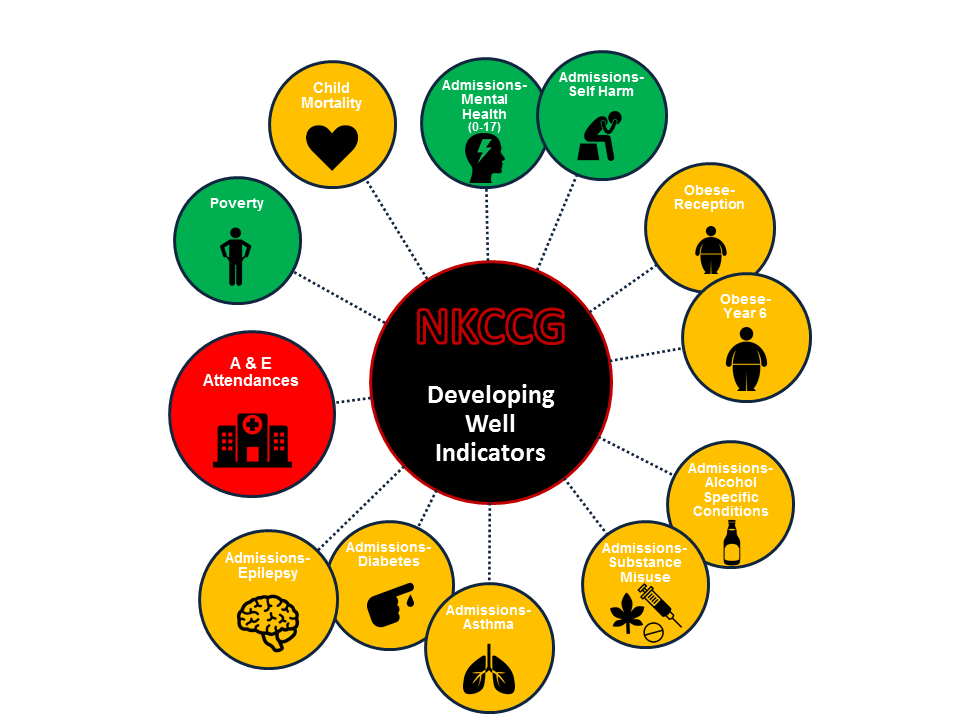
Developing well
 |
|
 |
|
| Key: Red = Higher than England Amber = Similar to England Green = Lower than England. Larger circle represents larger difference between CCGs |
Emotional health and wellbeing
Emotional wellbeing in 14 year olds (school years 9 and 10) does not differ significantly between CCGs.(14)
A baseline measure for resilience in children and young people (established in 2015(14)) shows that on average children and young people in Kirklees have good-to-average levels of resilience, with North Kirklees and Greater Huddersfield CCG being similar (14). One in 20 (5%) 14 year olds across both CCGs have problems getting to sleep because of feeling anxious or worried. (14) Slightly more 14 year olds in Greater Huddersfield self-reported anxiety or depression (similar to the Kirklees rate) than in North Kirklees (2% NK | 3% GH). (14)
Significantly more 14 year olds (school years 9 and 10) in North Kirklees say they have been bullied once a week or more in the past two months than Greater Huddersfield (12% NK | 8% GH). (14)
In 2015/16, the rate of hospital admissions for mental health conditions in those aged 0-17 was 84.7 per 100,000 nationally. The rate was significantly lower in North Kirklees than in Greater Huddersfield (35.1 per 100,000 NK | 40.8 per 100,000 GH).(15)
The 2015/16 rate of hospital admissions as a result of self-harm for 10-24 year olds across both CCGs is below the national average (422.8 per 100,000). (16)
Food, obesity and physical activity
Around three in five (64%) young people in Kirklees (aged 11-18 years) eat takeaway meals less than once a week/never. (14) This was lower in North Kirklees and higher in Greater Huddersfield (58% NK | 71% GH). (14)
Just over half of 14 year olds in North Kirklees and Greater Huddersfield have breakfast every day before school (52% NK | 55% GH). While one in six children in North Kirklees never eat breakfast before school and one in seven from Greater Huddersfield (16% NK| 15% GH). (14)
One in six 14 year olds in North Kirklees CCG and one in five 14 year olds in Greater Huddersfield eat five or more portions of fruit or vegetables a day (18% NK | 19% GH). (14)
Only one in six (18%) 14 year olds in Kirklees meets the recommended levels of 60 minutes of physical activity a day. This is slightly lower in North Kirklees and slightly higher in Greater Huddersfield (17% NK | 20% GH).(14)
However, 21% of 14 year olds in Kirklees do not take part in any regular exercise. This was slightly lower in North Kirklees and higher in Greater Huddersfield (19% NK | 20% GH). (14)
In 2015/16, the proportion of Reception children who were obese was around one in 10 (9.3%) nationally. Neither of the CCGs were significantly different from the national average (9.6% NK | 8.5% GH).(17) However, there were some significant differences between wards within the CCG areas:
- In NKCCG, around one in seven (13.6%) Reception children in Dewsbury West were obese compared with around one in 16 (6.3%) in Mirfield.
- In GHCCG, around one in nine (11.1%) Reception children in Golcar were obese compared with around one in 30 (3.4%) in Kirkburton.(18)
Nationally, in 2015/16, the proportion of Year 6 children who were obese was one in five (19.8%). Neither of the CCGs were significantly different from the national average (21% NK | 20.3% GH).(17) However, there were some significant differences between wards within the CCGS areas:
- In NKCCG, around one in four (27.4%) Year 6 children in Dewsbury West compared to around one in eight (13.3%) in Dewsbury East.
- In GHCCG, around one in four (25.4%) Year 6 children in Ashbrow were obese compared with around one in nine (10.6%) in Holme Valley South. (18)
In Kirklees in 2015/16, around three in four (76.5%) Reception children were a healthy weight, similar to nationally (76.9%). Trend data since 2007/08 (see Figure 10) shows that the gap in healthy weight between those living in the lowest and highest levels of deprivation has narrowed, although this is attributable to a decrease in healthy weight children living within the least deprived areas rather than an increase in healthy weight children within the most deprived areas. (18)
In Kirklees around three in five (62.5%) Year 6 children were a healthy weight, significantly worse than nationally (64.5%). Trend data since 2012/13 (see Figure 10) shows a decrease in the proportion of healthy weight children in the most and least deprived quintiles.
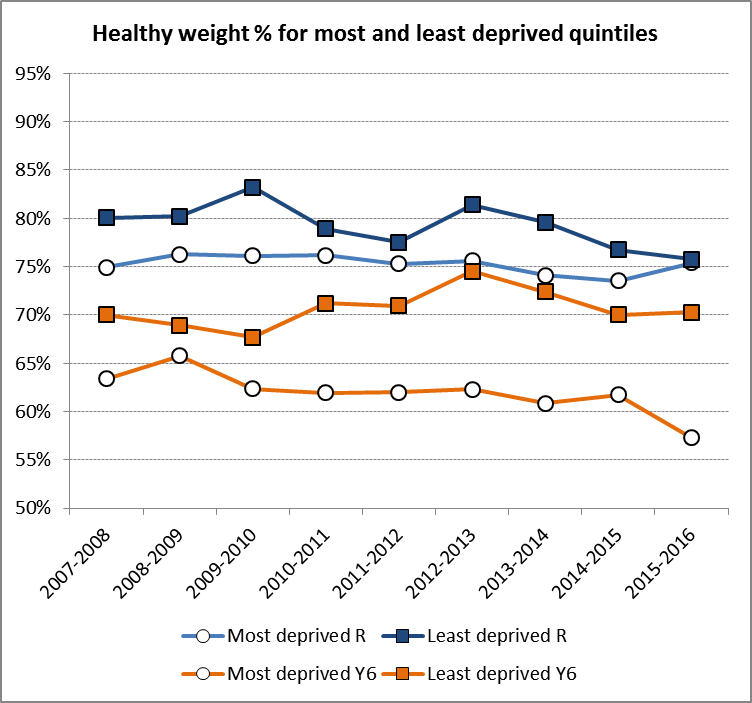 |
| Figure 10: Proportion of healthy weight Kirklees children (Reception and Year 6) in most deprived and least deprived quintiles (Data source: National Child Measurement Programme) |
Sexual health
Most 14 year olds in Kirklees have not had sex (14). The proportion of 14 year olds who have not had sex is similar in North Kirklees and Greater Huddersfield (87% NK | 88% GH). (14)
The screening rate for Chlamydia in young people aged 15 to 24 in Kirklees was 17% in 2016. This is significantly below the national average of 21%. The detection rate was similar to the national average at 2%. (19)
The overall Kirklees HPV vaccination coverage for females aged 12 to 13 in 2015/16 was 90% which was significantly above the national average. (19)
Tobacco, alcohol and drug misuse
Around half (51%) of 14 year olds have tried alcohol, showing a downward trend (reducing from 66% in 2009). This was significantly lower in North Kirklees than Greater Huddersfield (49% NK | 58% GH). (14)
The proportion of 14 year olds in Kirklees who drink weekly or more showed a significant reduction from 22% in 2009 to 10% in 2014. This was higher in North Kirklees than in Greater Huddersfield (11% NK | 8% GH). (14)
The rate of young people under 18 admitted to hospital for alcohol specific conditions was the same for both CCGs (30.3 per 100,000) and similar to nationally (36.6 per 100,000). (20)
5% of 14 year olds in Kirklees smoke regularly which is similar to 2009. Regular smoking was slightly lower in North Kirklees than in Greater Huddersfield (4% NK | 5% GH) (14).
Over one in three (34%) 14 year olds in Kirklees live with an adult who smokes. This was the same in North Kirklees and Greater Huddersfield (both 33%). (14)
One in 10 children and young people aged 11-19 year in Kirklees report using e-cigarettes. This indicator provides a new baseline for future analyses. (14) This was higher in North Kirklees than in Greater Huddersfield (11% NK | 8% GH). (14)
One in 11 14 year olds report having tried drugs in North Kirklees and this was significantly lower in Greater Huddersfield (9% NK | <1% GH). There is a non-significant difference between the proportion of 14 year olds in the least and most deprived areas who have tried drugs (6% and 12%, respectively). (14)
Although cannabis is the most commonly used drug, the vast majority (93%) of 14 year olds in Kirklees have never tried it. This was similar in North Kirklees and Greater Huddersfield (93% NK | 92% GH). (14)
During 2013/14-2015/16, the rate of hospital admissions due to substance misuse in young people aged 15-24 was 94.0 per 100,000 nationally. This was not significantly different to either CCG although the rate is higher in North Kirklees than Greater Huddersfield (95.0 per 100,000 NK | 75.3 per 100,000 GH). (20)
Young carers
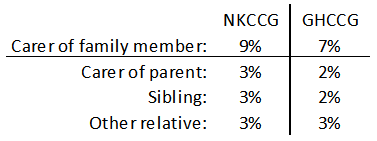
A young carer is a person aged between eight and 18 years who provides unpaid care to somebody because of a physical disability; mental ill health; sensory impairment; substance misuse; long-term condition; learning disability or illness.
In 2014, 8% of Kirklees young people identified themselves as carers of a parent, relative, brother or sister (14).
Long term conditions
One in eight (13%) 14 year olds in Kirklees reports having a health problem or disability. This is a slight increase from one in ten (11%) in 2009. This was similar in Greater Huddersfield but this was higher in North Kirklees (15% NK | 12% GH). (14)
One in 14 (7%) 14 year olds in Kirklees report having asthma (8% NK | 6% GH). Asthma rates are higher in the most deprived areas and slightly higher in girls (8%) than boys (6%). (14)
The 2015/16 rate of under-19 hospital admissions for asthma is worse than nationally (216.1 per 100,000) for both North Kirklees and Greater Huddersfield (294.4 per 100,000 NK | 196.5 per 100,000 GH). (21)
The 2015/16 rate of under-19 hospital admissions for diabetes is similar to nationally (55.4 per 100,000) for both North Kirklees and Greater Huddersfield. (43.8 per 100,000 NK | 53.3 per 100,000 GH). (21)
The 2015/16 rates of under-19 hospital admissions for epilepsy in North Kirklees and Greater Huddersfield are higher than nationally (187.7 per 100,000 NK | 110.4 per 100,000 GH compared with 76.6 per 100,000 nationally). (21)
In 2015/16, the rate of A & E attendances for under-18s in Greater Huddersfield (345 per 1000) was significantly better than nationally (405 per 1000). North Kirklees had a significantly worse rate (573 per 1000) and the highest rate regionally. (21)
Deprivation is strongly associated with many adverse health outcomes; in 2016, the rate of children under 16 living in poverty in North Kirklees was 87.9 per 1000 and in Greater Huddersfield it was 59.3 per 1000. This reflects the general proportion of people living in the most deprived areas across the CCGs. See earlier section on deprivation.
Compared to the rate nationally (199.0 per 1000, in 2014) both CCG areas have a significantly lower rate of under-16s living in poverty and, despite the North Kirklees rate being slightly higher, there are no significant differences between the areas. However, there are significant inequalities within each CCG area. (21)
The rolling three-year figures for 2013-15 indicate that the child mortality rates in Greater Huddersfield (15.5 per 100,000) and North Kirklees (17.0 per 100,000) are not significantly different to nationally (11.9 per 100,000). (21)
Living well
This stage of the life course spans the ages 18 to 64, and covers more than 60% of the population of Kirklees. Although many people are continuing to work beyond 64, for convenience we are also referring to this age group as ‘working age’.
Lifestyle choices and health behaviours that people in this age group adopt can have a real impact upon their physical and emotional wellbeing, and increase their ability to lead a full life into old age. Enabling people to adopt a healthier lifestyle during this phase of life, alongside addressing the wider determinants of health such as income, employment and housing, is a key challenge to tackle the trend within Kirklees of an aging population with more complex health needs.
General health and wellbeing
Self-reported health state suggests that people in Greater Huddersfield are generally in better health than those in North Kirklees. In Greater Huddersfield one in 12 of people aged 18-64 rate their health as bad/very bad, a significantly lower figure than the one in eight in North Kirklees (12% NK | 8% GH). (22)
Compared with Greater Huddersfield, North Kirklees also has significantly lower scores for the EuroQol EQ-5D tool, a measure of health-related quality of life, and the Short Warwick-Edinburgh Mental-Wellbeing Scale (SWEMWBS), a measure of emotional wellbeing. (22)
Food, Physical Activity and Obesity
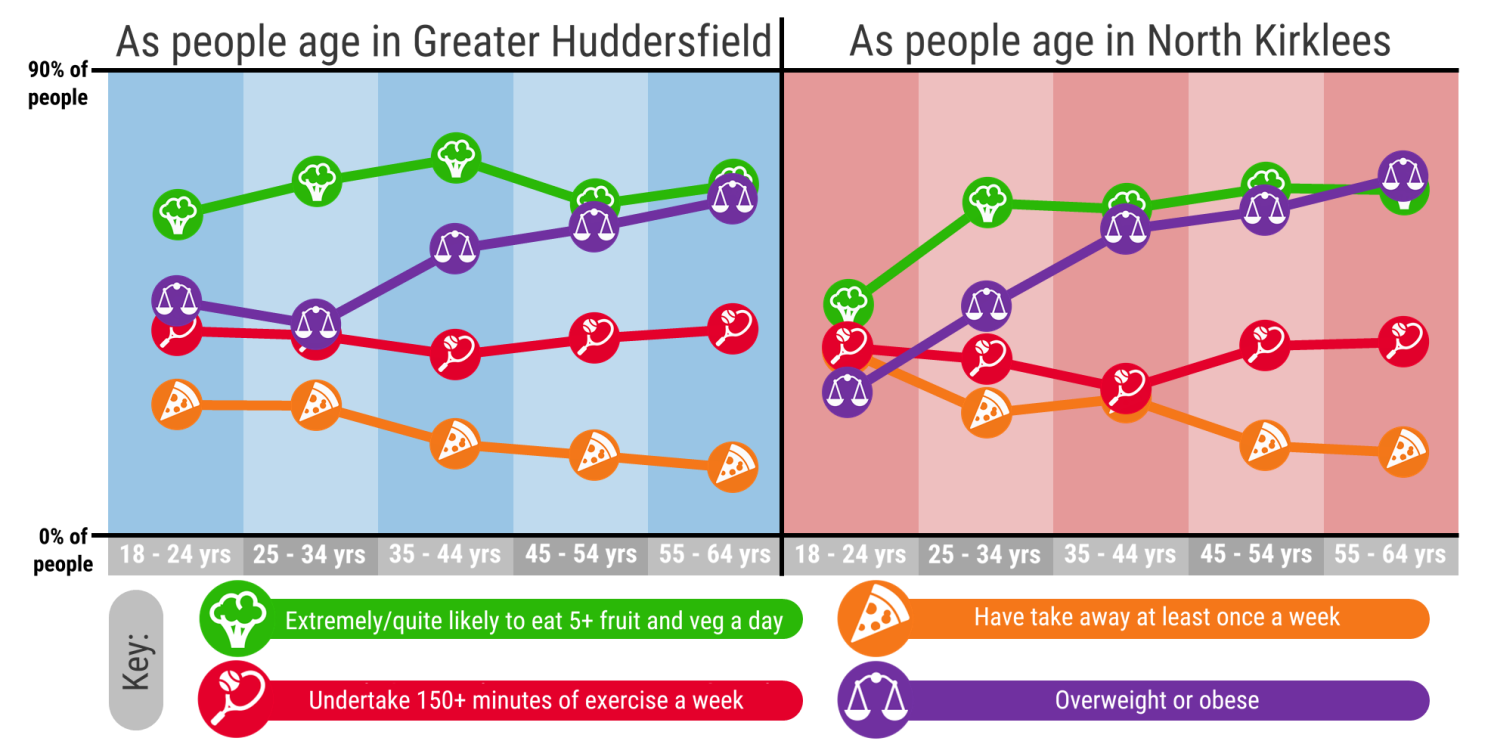
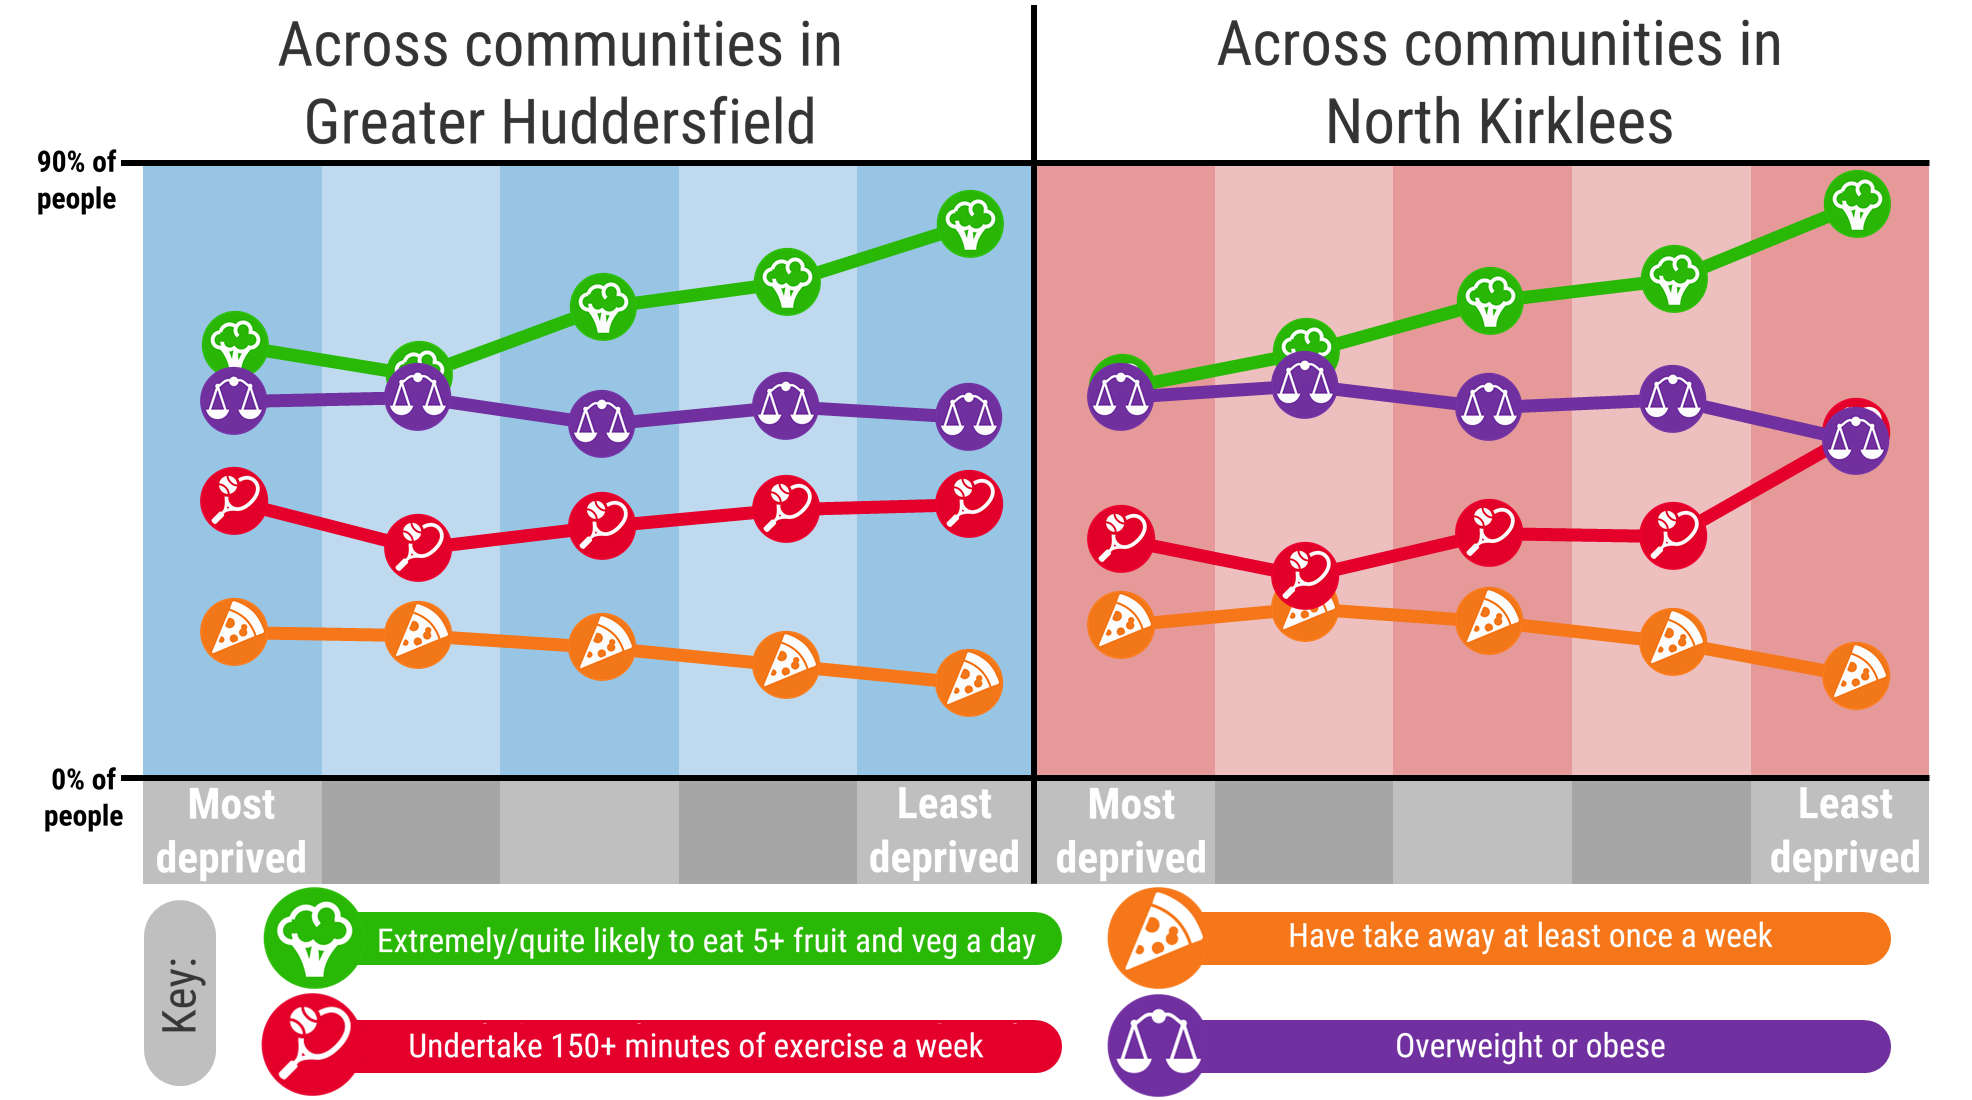
People aged 18-64 in North Kirklees are significantly less likely to eat five portions of fruit and vegetables per day than people in Greater Huddersfield (63% NK | 67% GH are very/quite likely to eat 5+ portions of fruit/veg). (22)
Almost one in four people in North Kirklees eats fast food or takeaway meals at least once a week, compared to less than one in five in Greater Huddersfield (23% NK | 19% GH) (22).
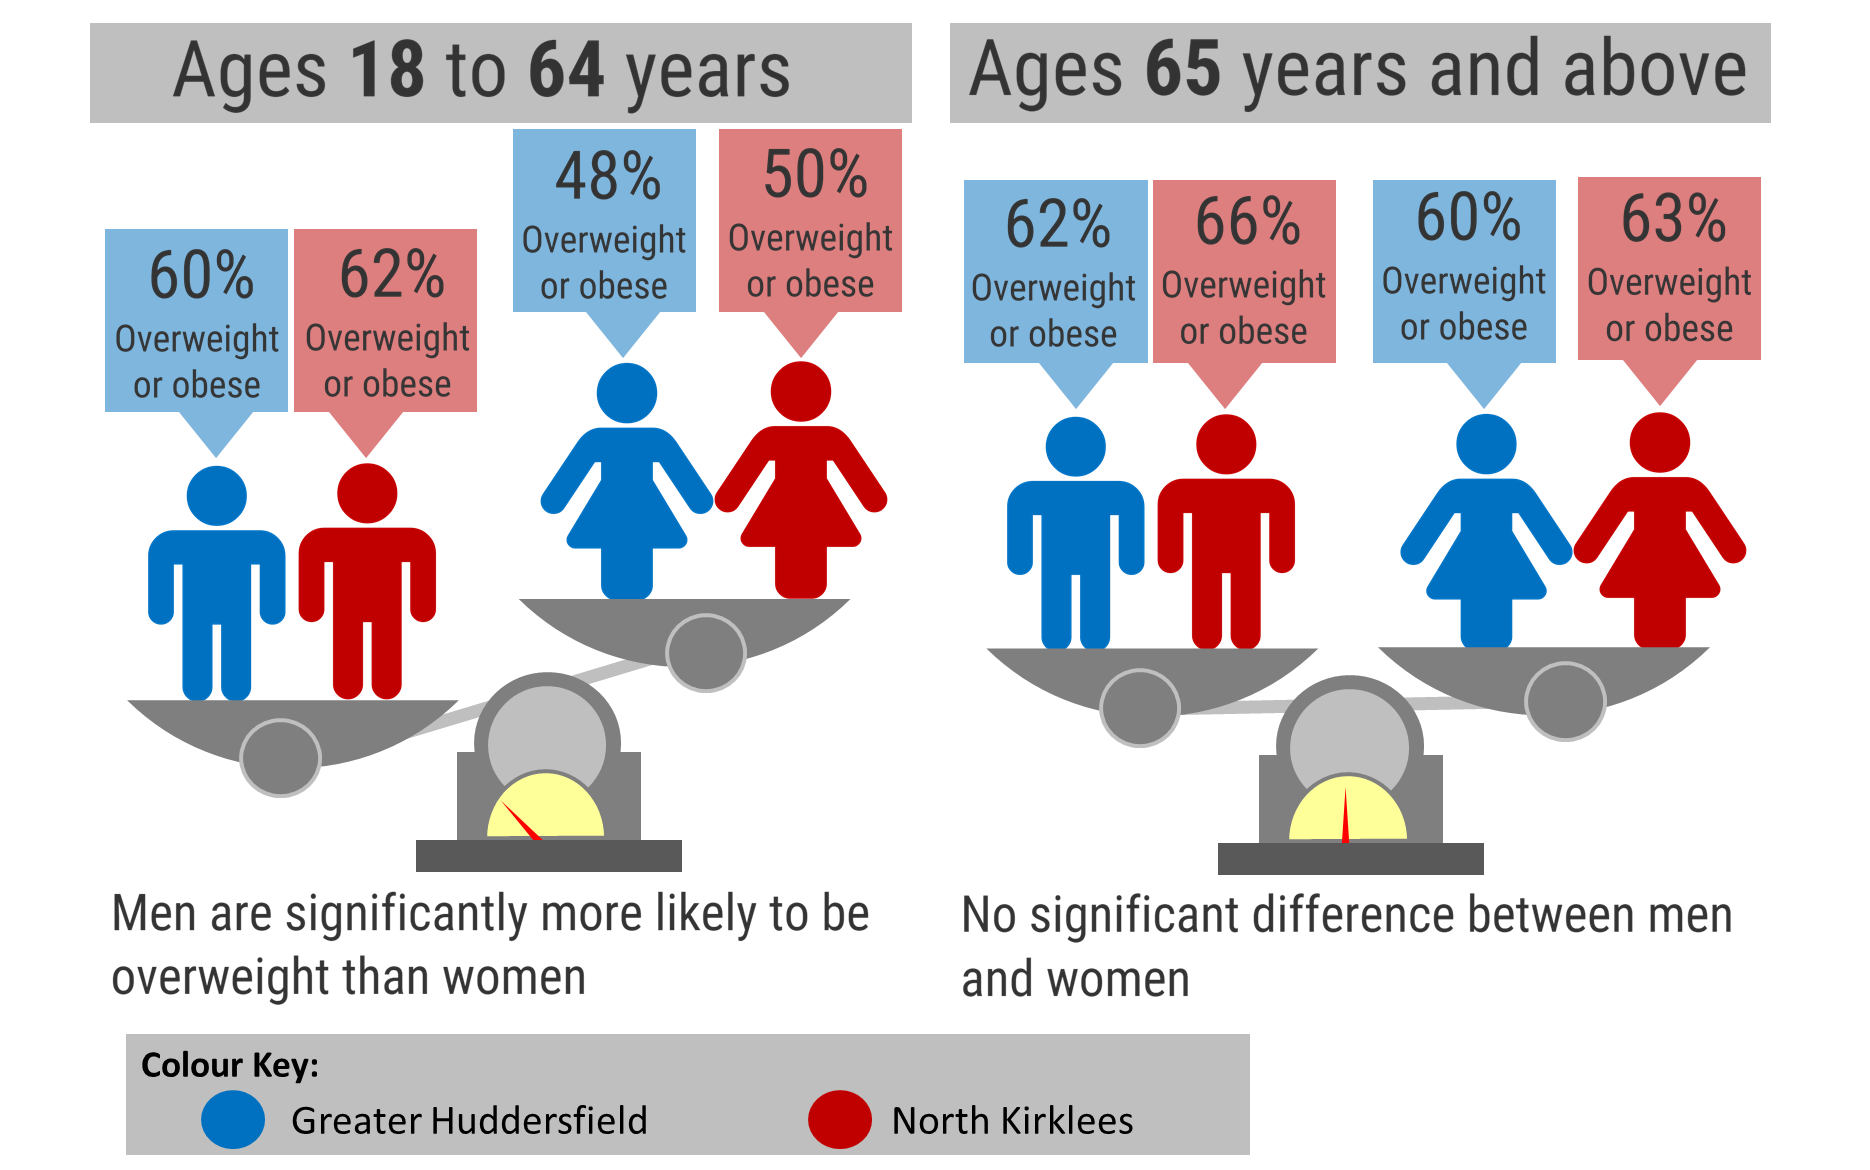
Despite these differences in diet there is no significant difference between the CCGs in the proportion of people categorised as overweight (including obese); over half of adults in both CCGs are overweight/obese (55% NK | 53% GH). Adult obesity rates are significantly higher in North Kirklees; one in four (24%) are obese in North Kirklees and one in five (20%) are obese in Greater Huddersfield. (22)
Just over a third of people achieve the recommended physical activity levels (30+ minutes of moderate physical activity five times per week). The rate is significantly higher in GH (34% NK | 38% GH). Around 1 in 10 people never do 30+ minutes of moderate physical activity. (22)
As people age, some aspects of diet appear to improve, with reduced take away consumption in both CCGs and an increase in the likelihood of eating fruit and veg in North Kirklees. At the same time, achievement of the recommended 150 minutes of moderate physical activity holds relatively stable. However, the proportion of people overweight is highest amongst those aged 55-64. (22)
As relative deprivation levels decline, some aspects of diet improve and physical activity holds largely constant. However, there appears to be a steeper social gradient in North Kirklees with significantly higher rates of physical activity and lower rates of overweight/obesity in the least deprived quintile compared with the most deprived quintile. (22)
Tobacco, Alcohol and Drug Misuse
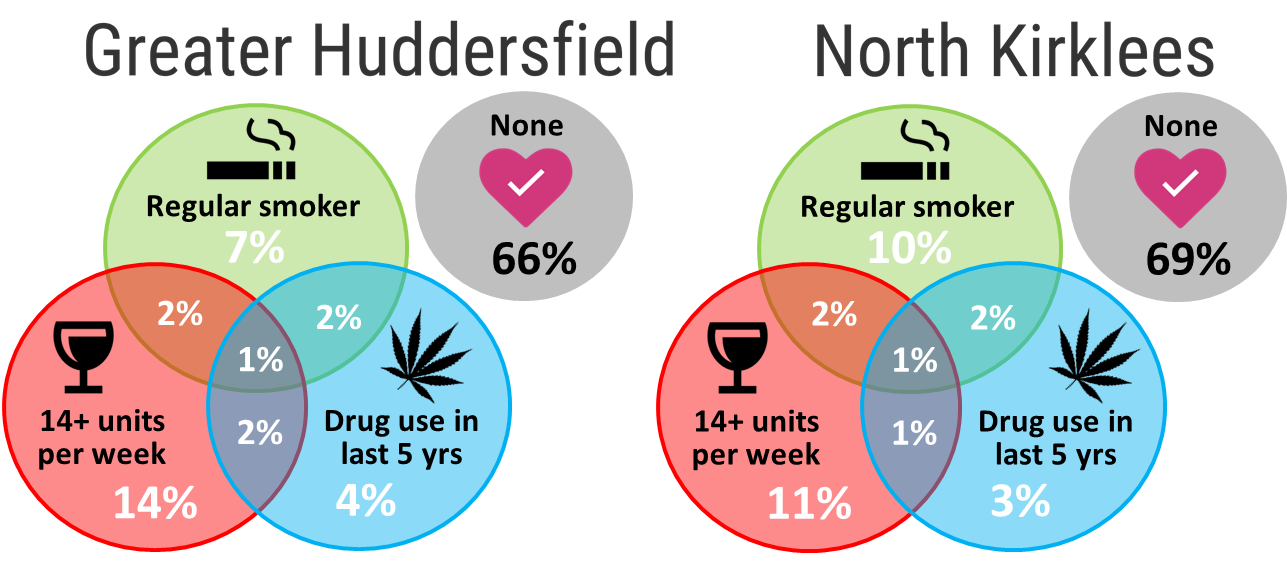
People of working age are significantly more likely to be regular smokers (at least one cigarette a day) in North Kirklees than Greater Huddersfield (one in six, 16% NK | one in eight, 13% GH). (22) Applying these prevalence rates to the 2015 population, there are an estimated 18,629 and 15,772 regular smokers aged 18-64 in Greater Huddersfield and North Kirklees, respectively. (23)
Regular smoking among those of working age has declined since the previous local population survey in 2012, from 19% in North Kirklees and 16% in Greater Huddersfield. (24)
Children are particularly vulnerable to the detrimental effects of passive smoking on their health. Around a third of regular adult smokers under the age of 65 live with children (33% NK | 28% GH), although this increases to half for those aged 25-34 (56% NK | 49% GH).
Smoking is much more common in more deprived areas. In Greater Huddersfield regular smoking rates are four times higher in the most deprived areas compared to the least deprived areas (19% vs 5%); in North Kirklees rates in the most deprived areas are double those in the least deprived areas (22% vs 10%). (22)
Around one in 15 people aged 18-64 use e-cigarettes (7% NK | 6% GH). Of those using e-cigarettes less than half also smoke standard cigarettes regularly (46% NK | 40% GH). (22)
A larger proportion of people living in North Kirklees never drink alcohol (34% NK | 20% GH). Of those people that do drink alcohol, there is no significant difference between the two CCGs in the proportion of people who drink more than the weekly recommended limit of 14 units of alcohol (23% in Greater Huddersfield and 22% in North Kirklees). However, because fewer people drink alcohol, North Kirklees has a significantly smaller proportion of excess drinkers (14% of people aged 18-64) compared to Greater Huddersfield (19%). (22)
Of those who drink alcohol above the recommended limit, around half aged 18-64 (48% NK | 50% GH) were not concerned about the quantity that they drink. A further one in three (35% NK | 32% GH) expressed concern, but no desire to reduce their consumption. Around one in 20 (7% NK | 3% GH) wanted support to reduce the amount they drank. (22)
Neither of the CCGs were significantly different from the national average for alcohol-related hospital admissions (103 per 100,000 NK | 102 GH | 117 England). When assessed against the ten most similar CCGs in England (as defined by NHS England (25), neither CCG was significantly different from the average value of the top five performing CCGs in its set. (26) (27)
The proportion of people aged 18-64 who have used illegal or recreational drugs in Greater Huddersfield (10%) is significantly higher than those in North Kirklees (8%). (22)
The population with the combined risky behaviours of smoking, using recreational drugs in the last 5 years and drinking more than 14 units per week is very small, accounting for one in 100 (1%) in Kirklees. (22)
Future attitudes towards health
Most people aged 18-64 believe that staying active is an important part of having a long and healthy retirement (93% NK | 96% GH). Those that believe in the importance of keeping physically active were around twice as likely to meet the recommended minimum level of exercise per week than those who did not think it was important (including those who did not know) (40% vs 19% NK | 39% vs 20% GH). (22)
The perceived importance of physical activity decreased with deprivation, and was lower in those of South Asian ethnicity (relative to the White population) and males. (22)
Long term conditions
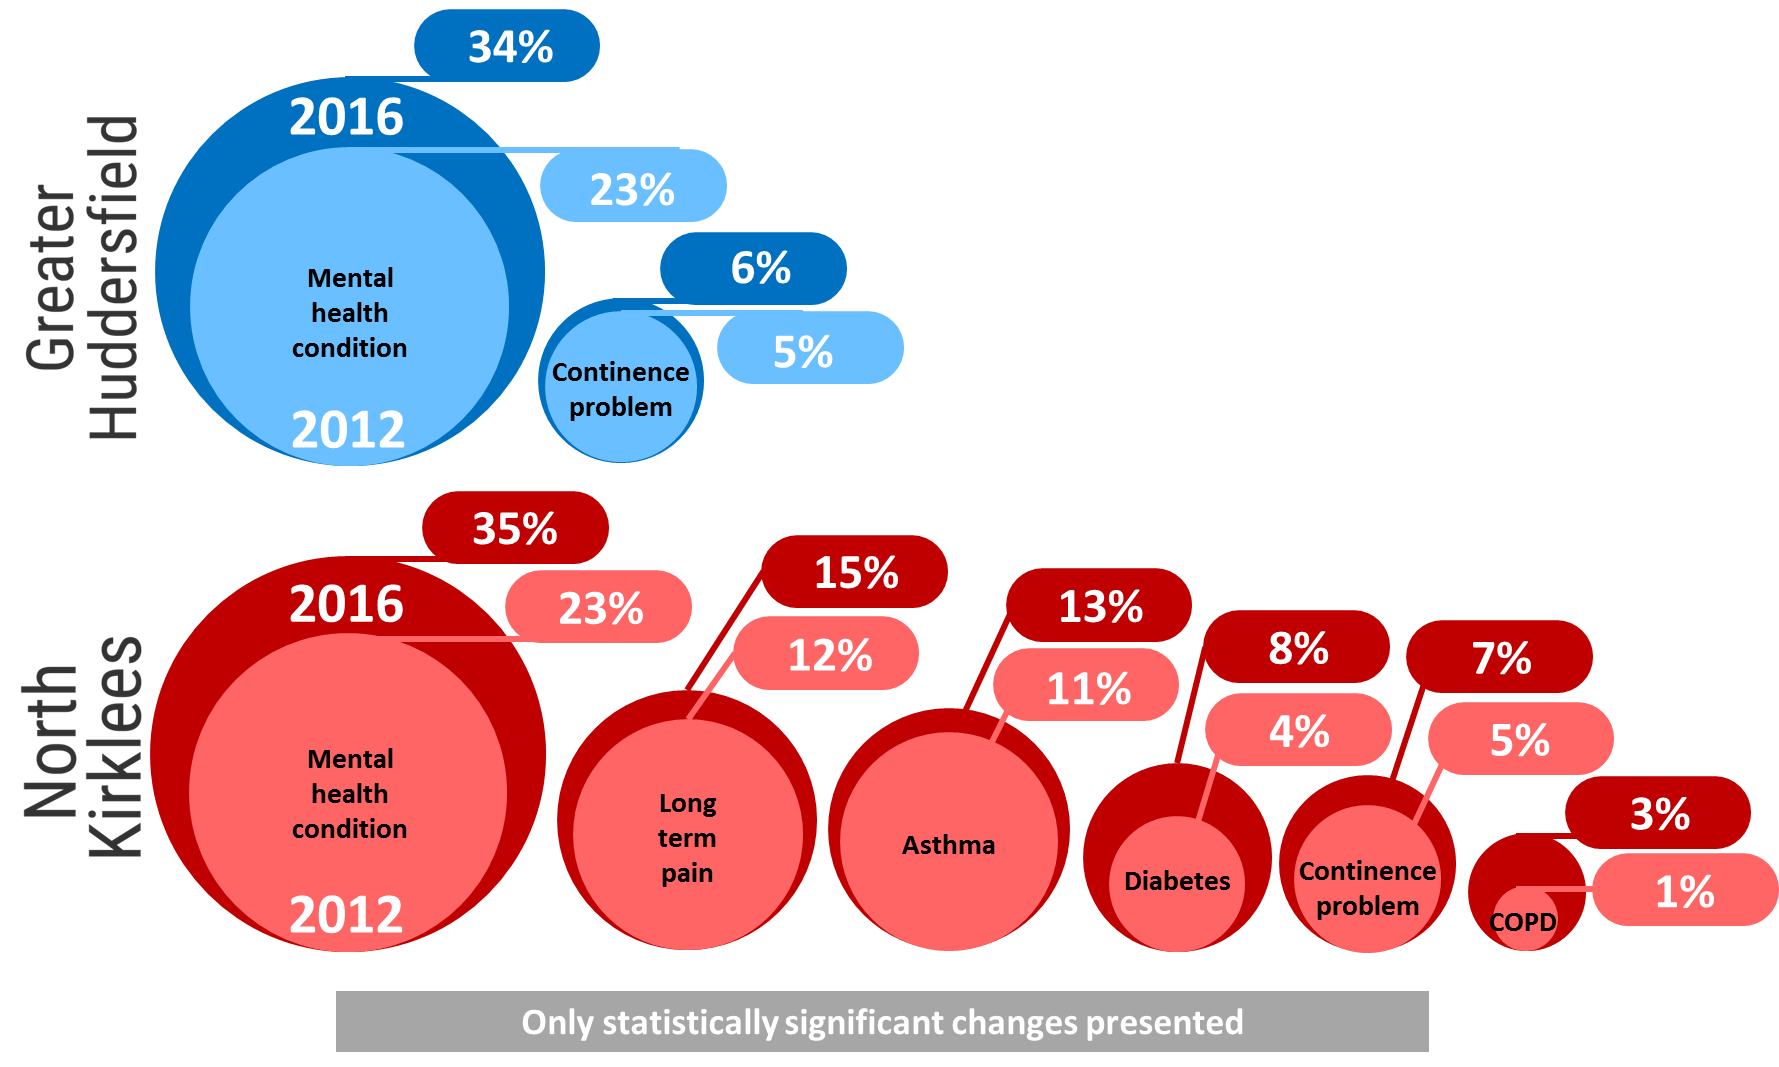
Significantly more working age people in North Kirklees than Greater Huddersfield have three or more long-term health conditions (almost one in three, 30% NK | one in four, 25% GH). (22)
The most common long-term conditions reported by those aged 18-64 are mental health conditions (35% NK | 34% GH); back pain (16% NK | 15% GH); musculoskeletal issues (14% NK | 12% GH); long-term pain (15% NK | 12% GH) and high blood pressure (16% NK | 12% GH). (22)
Comparing prevalence rates of 12 long-term conditions from the Current Living in Kirklees (CLiK) surveys in 2012 and 2016, prevalence has increased for several specific conditions and has not decreased for any condition. (22)
The employment rate in those of working age is 13% lower for those with a long term condition compared to those without a condition. This difference is significantly lower than the national average (14%). (26) (27)
Diabetes
A modelling exercise undertaken in 2015 suggested that there were 22,160 people aged 16 and above with non-diabetic hyperglycaemia in Greater Huddersfield and 16,987 in North Kirklees (11% of the registered population for both CCGs). (28) Presence of non-diabetic hyperglycaemia is a major risk for the development of type 2 diabetes. (29)
The self-reported prevalence of diabetes is significantly higher in North Kirklees (8%) than Greater Huddersfield (5%). (22) This may in part reflect the differences in ethnic profiles of the two areas. The prevalence of diabetes in people of South Asian ethnicity is almost three times higher than for those of White ethnicity (14% vs 5%). (22) From the 2011 census, the proportion of people of South Asian ethnicity aged 25-64 was 20% in North Kirklees and 9% in Greater Huddersfield. (30)
The National Institute for Health and Care Excellence (NICE) recommends that people with diabetes should have nine key tests and evaluations undertaken annually. (31) Data shows that less than half of those aged under 65 years who have type 2 diabetes receive at least eight of the processes (46% NK | 45% GH), both significantly lower than national average (61%). Values are lower for people with type 1 diabetes (34% NK | 37% GH), although these are not significantly different from the national average (34%). (32)
For a more general review of diabetes in Kirklees, please see the diabetes section.
Cancer
There is no significant difference in the age standardised incidence rates for all cancer types between the two Kirklees CCGs and the national average. (33)
The most commonly diagnosed types of cancer are lung, breast, prostate and colorectal. (33)
Around one in five cases of cancer in North Kirklees (22%) is diagnosed as a result of an emergency presentation. In Greater Huddersfield, the value is slightly less (18%). (34)
For a more general review of cancer in Kirklees, please see the cancer section.
Respiratory Conditions
Around one in nine people report having asthma (requiring the use of an inhaler) (13% NK | 11% GH). Chronic Obstructive Pulmonary Disorder (COPD) affects one in 30 (3%) in North Kirklees and one in 50 in Greater Huddersfield (2%). (22)
North Kirklees has significantly higher emergency admissions for asthma, in children and adults, and acute lower respiratory infections in adults than the national average (176 per 100,000 people in North Kirklees and 78 per 100,000 in England). (35)
Greater Huddersfield had the third highest rate of emergency COPD admissions per 100,000 in its group of 10 most similar CCGs. (36)
For a more general review of respiratory conditions in Kirklees, please see the respiratory conditions section.
Mental Health Conditions
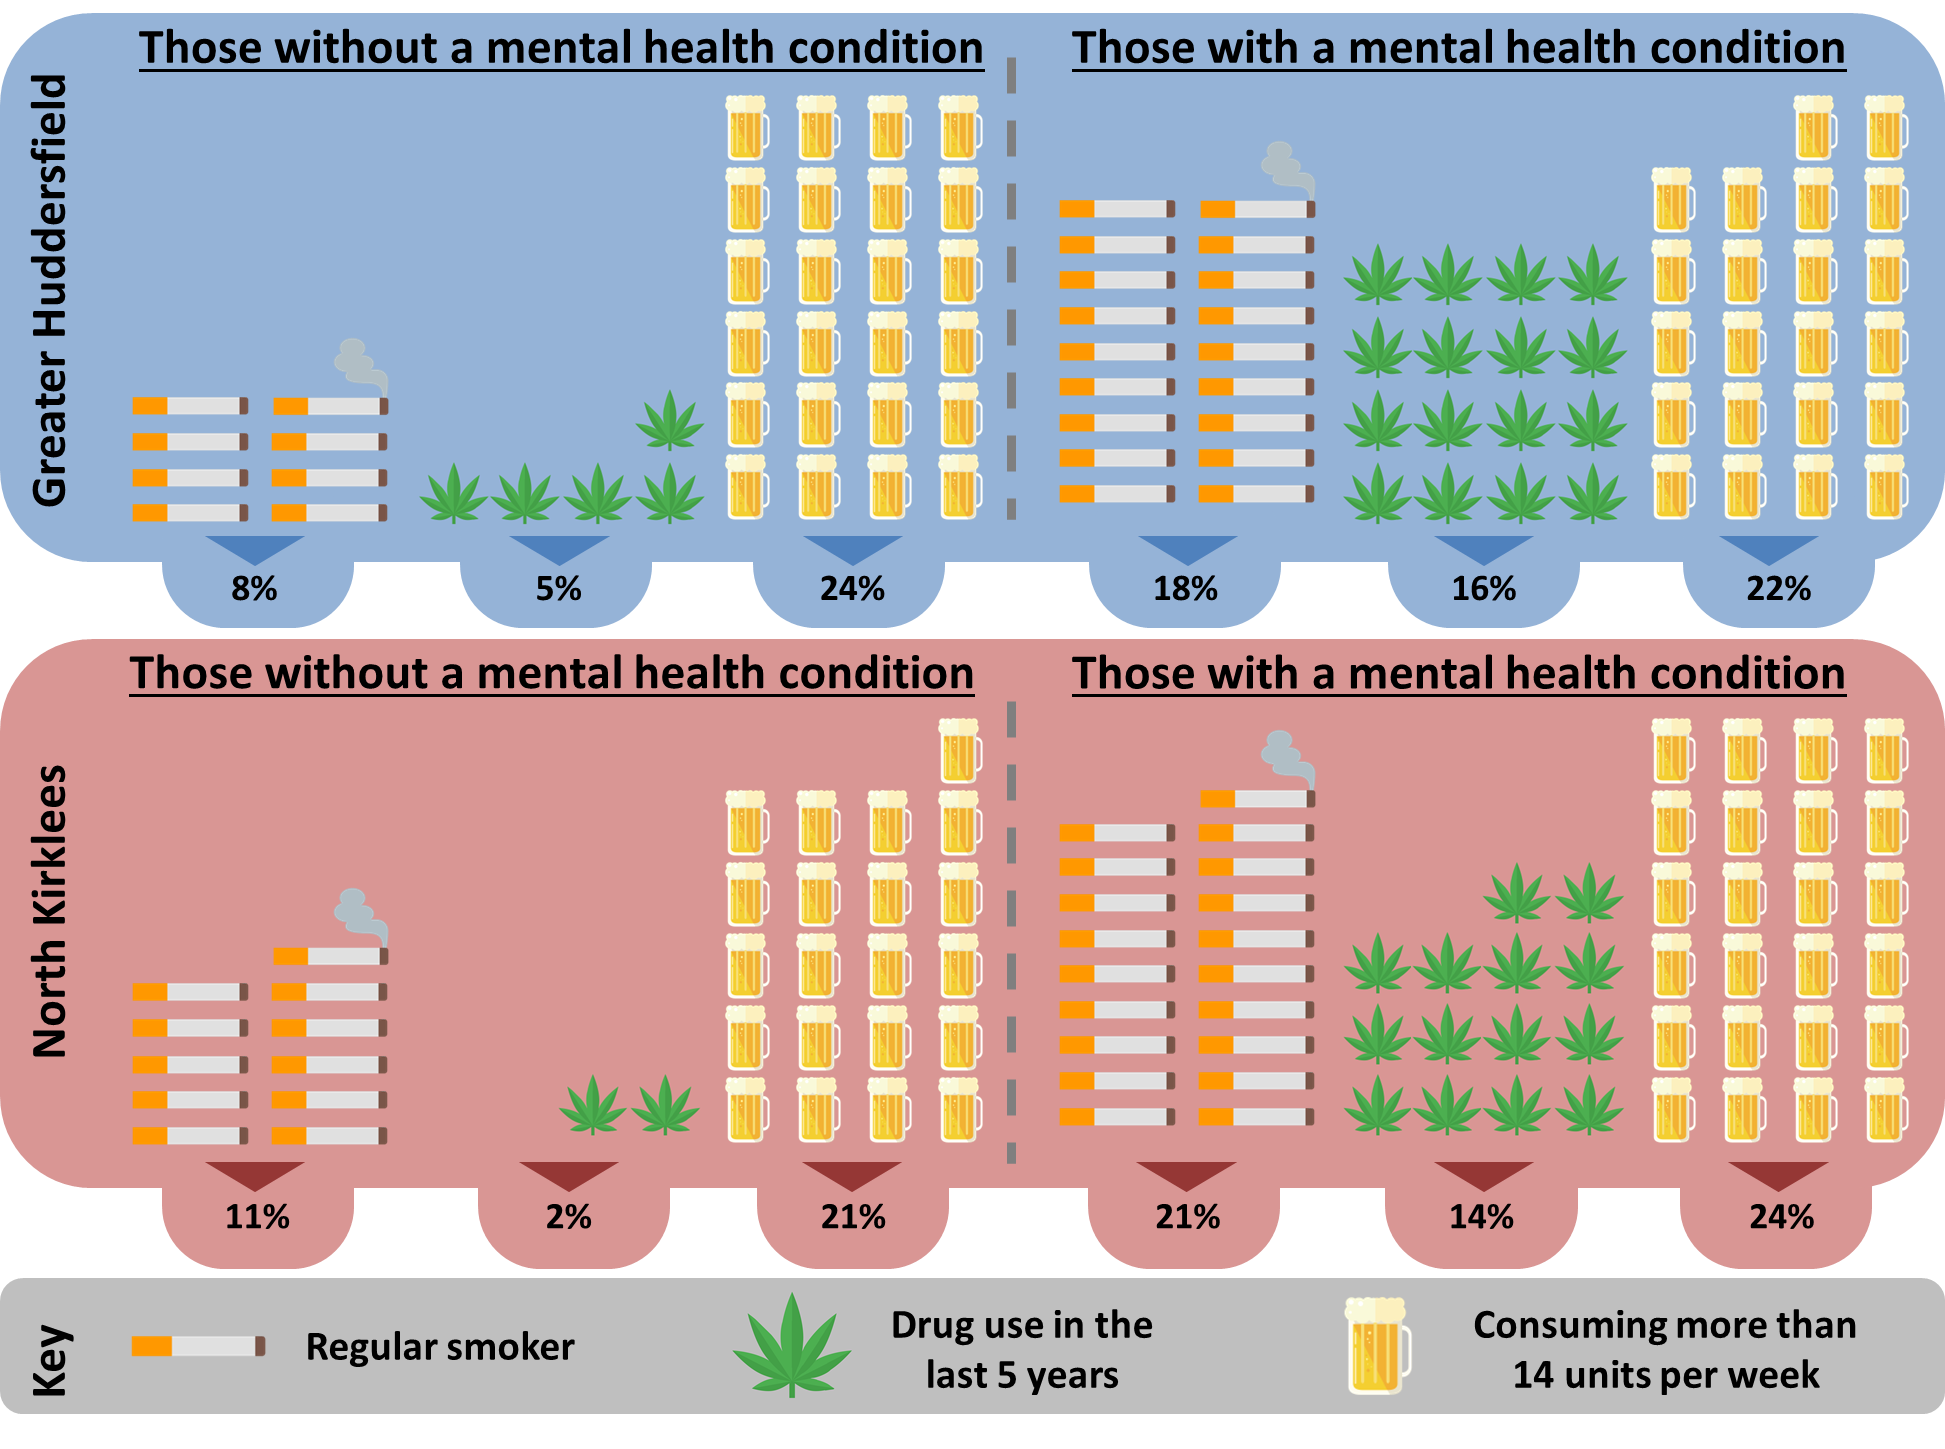
Mental health conditions are more common amongst younger adults, affecting almost one in two people aged 18 to 24 years olds (44% in both CCGs), and falling to just over one in four people aged 55 to 64 (31% NK | 27% GH). (22)
People with mental health conditions are significantly more likely to be regular smokers and have used recreational drugs in the last 5 years. There was no significant difference between the proportion of people with or without mental health conditions who drink excessively (more than 14 units per week). (22)
Both CCGs have a high rate of provision of Improving Access to Psychological Therapies (IAPT) relative to the estimated size of the population suffering from depression or anxiety (10%, amongst the highest rate compared with similar CCGs). (37) (38)
Care, self-care and independence
Around 9 in 10 people aged 18-64 are confident in their ability to manage their own health (86% NK | 89% GH). People with 3 or more long-term conditions are significantly less likely to be confident than those who have no long-term conditions (69% vs 97% NK | 70% vs 98% GH). (22)
The extent to which people access support for their health condition depends upon the condition. The proportion of people NOT accessing support for their condition ranges from over six in ten for continence issues (63% NK | 69% GH) to around four in ten for high blood pressure (40% NK | 39% GH). There is no clear link between level of support accessed and deprivation levels, or between level of confidence managing own health condition and level of support accessed. (22)
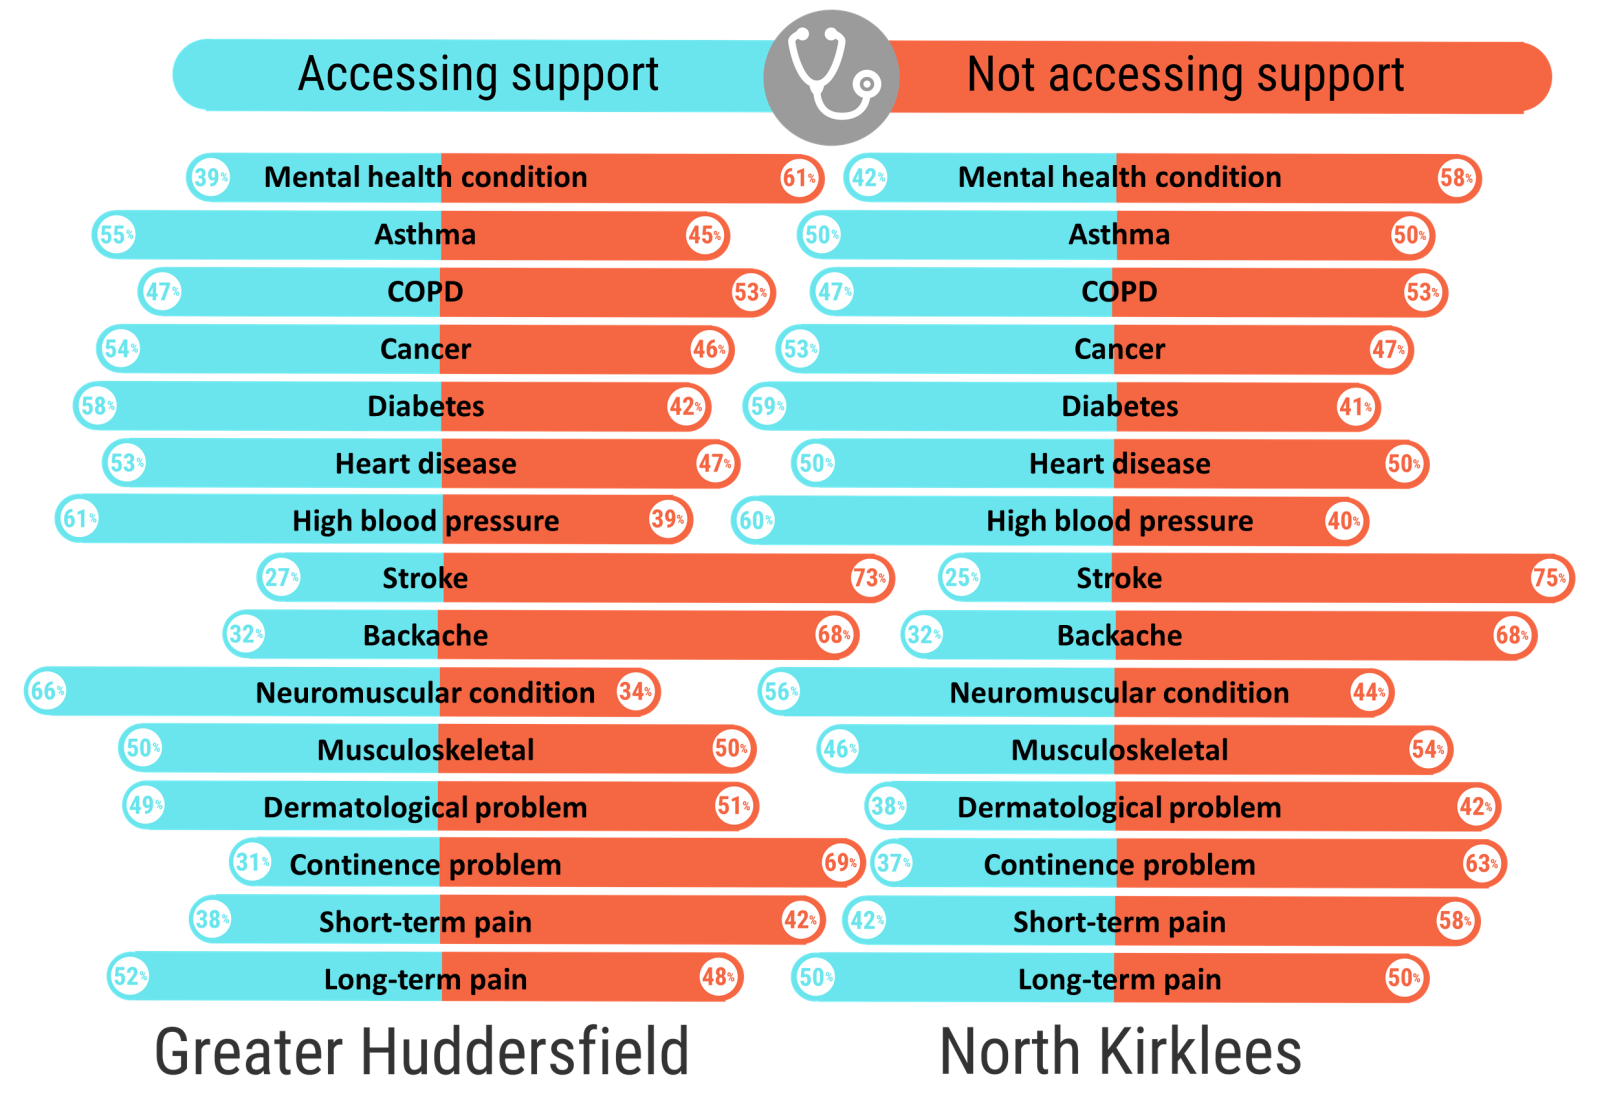
The proportion of people who feel supported to manage their condition is significantly higher for Greater Huddersfield than for North Kirklees or England (65% NK | 69% GH | 64% England). (26) (27)
Mortality
Age standardised mortality rates are similar across the two Kirklees CCGs for cancer, circulatory, respiratory disease, liver disease, and suicide. (39)
North Kirklees has a mortality rate from respiratory conditions which is significantly higher than the national average (49.6 per 100,000 NK | 33.1 England). (39)
Health Protection
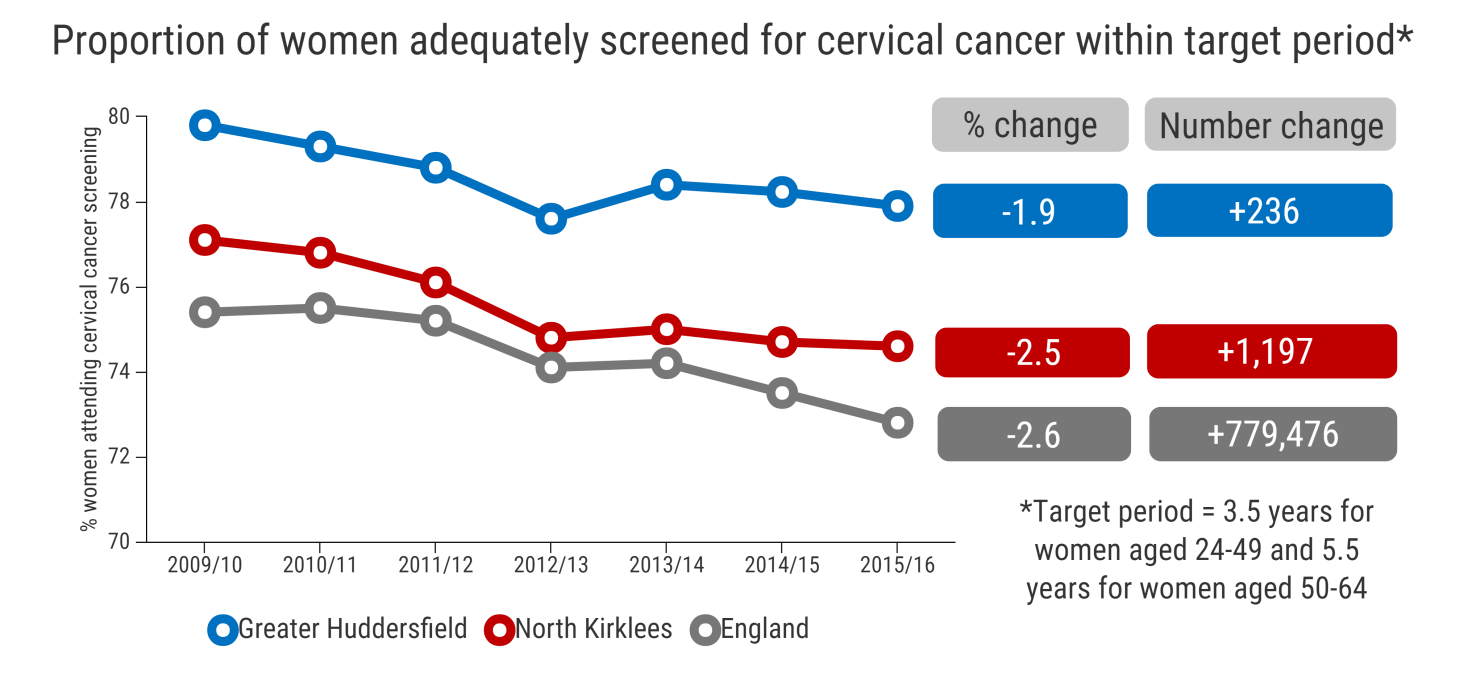
Cancer screening coverage (% of eligible) in North Kirklees is significantly below the national average for colorectal cancer (56% NK | 58% England) and breast cancer (69% NK | 72% England). The colon cancer screening rate in Greater Huddersfield (64%) is significantly above the national average. Both CCGs have cervical cancer screening rates which are significantly above the national average, although there is a downward trend in uptake both locally and nationally. Despite this, the number of women screened annually has increased since 2009/10. (34)
Both CCGs have seasonal flu vaccination uptake rates (at-risk groups) that are significantly below the national average (48% NK | 49% GH | 50% England). (40)
Both CCGs are slightly above the median England value for prescription of antibiotics. Greater Huddersfield prescribes 180 antibiotic items per 1,000 people per quarter (ranked 88th highest out of 209 in England); North Kirklees prescribes 182 items (ranked 80th). (41)
Ageing well
While the health of younger people tends to be less strongly affected by their behaviours, unhealthy lifestyles in youth and early adulthood significantly determine a person’s health and wellbeing in later life. Later interventions, although important, are considerably less effective where good early foundations are lacking.
The number and proportion of people aged 65 years and over resident in Kirklees will rise in the future. In Greater Huddersfield the number of people aged 65+ will rise from 42,716 (18% of the population) to around 57,200 (21%) by 2030. In North Kirklees over the same period the 65+ population is projected to rise from 30,462 (16%) to around 40,900 (20%).(42)(6)
The prevalence of common long-term conditions (e.g. heart disease, hypertension, stroke, respiratory disease, and diabetes) all increase as people get older, along with other conditions such as visual impairment, organic mental disorders and physical disabilities. These factors have a significant impact on an individual’s independence and need for care and support. Prevention and early intervention is therefore vital to enable people to be as well as possible for as long as possible, live independently and have control over their lives.
General health and wellbeing
The proportion of people aged 65+ who describe their health as bad/very bad is similar to those aged 18-64 (12% in both age groups, NK | 8% of 18-64 vs 11% of 65+, GH). People aged 65+ were more likely than those aged 18-64 to describe their health as fair (26% of 18-64 vs 41% of 65+, NK | 22% of 18-64 vs 39% of 65+, GH) and less likely to report their health as good/very good. (22)
People aged 65+ have statistically significantly worse health-related quality of life than those under the age of 65, as shown by the EuroQol EQ-5D score, but better emotional wellbeing based on the Short Warwick-Edinburgh Mental-Wellbeing Scale (SWEMWBS). This may be due in part to increased levels of resilience in older people – a significantly lower proportion of people aged 65+ disagreed with the statement ‘I tend to bounce back quickly after hard times’ (17% of 18-64 vs 8% of 65+, NK | 16% of 18-64 vs 8% of 65+, GH). There were no significant differences between the CCGs (22).
Food, Physical Activity and Obesity
Around seven in ten people in Kirklees aged 65+ describe themselves as likely or very likely to consume five pieces of fruit and vegetables a day (69% NK | 71% GH). The likelihood is greater in less deprived areas (an absolute increase between most and least deprived areas of 10% in North Kirklees, and 3% in Greater Huddersfield). (22)
Around four in ten (41% NK | 39% GH) people aged 65+ achieve the minimum recommended weekly level of exercise (150 minutes of moderate physical activity). The proportion of people who undertake no physical activity in a typical week is twice as high for those aged 75+ compared with those aged 65-74 (12% for 65-74 vs 20% for 75+, NK | 9% for 65-74 vs 22% for 75+, GH). (22)
For those aged 65+, the proportion of people overweight reaches almost two in three (64% NK | 61% GH). In those aged 18-64, males are significantly more likely to be overweight or obese than females. In the age group 65+, a significantly higher proportion of females are overweight (compared with women aged 18-64), and there is no significant difference between males and females. (22)
Tobacco, Alcohol and Drug Misuse
People in older age groups are less likely to be regular smokers than those in younger age groups (16% for those aged 18-64 vs 8% for 65+, NK | 13% for 18-64 vs 6% for 65+, GH). (22)
Despite the fall in the number of smokers, those that continue to smoke later in life appear to be more resistant to change in their behaviour. The proportion of regular smokers who do not want to stop smoking doubles for those aged 65+ compared with those aged 18-64 (22% for those aged 18-64 vs 48% for 65+, NK | 16% for 18-64 vs 40% for 65+, GH). (22)
Levels of excess drinking are similar in those aged 65+ compared with those aged 18-64. However, the proportion of people who drink more than 14 units per week is significantly higher amongst those aged 65 to 74 (28% of those that drink in both CCGs) than those aged 75 and above (14% NK | 18% GH). (22)
Less than 1% of people aged 65+ report having used illegal or recreational drugs in the last 5 years. (22)
Long term conditions
Around one in eight people aged 65+ do not have any long-term health conditions (11% NK | 13% GH). Around four in ten people have three or more long-term conditions (44% NK | 40% GH). (22)
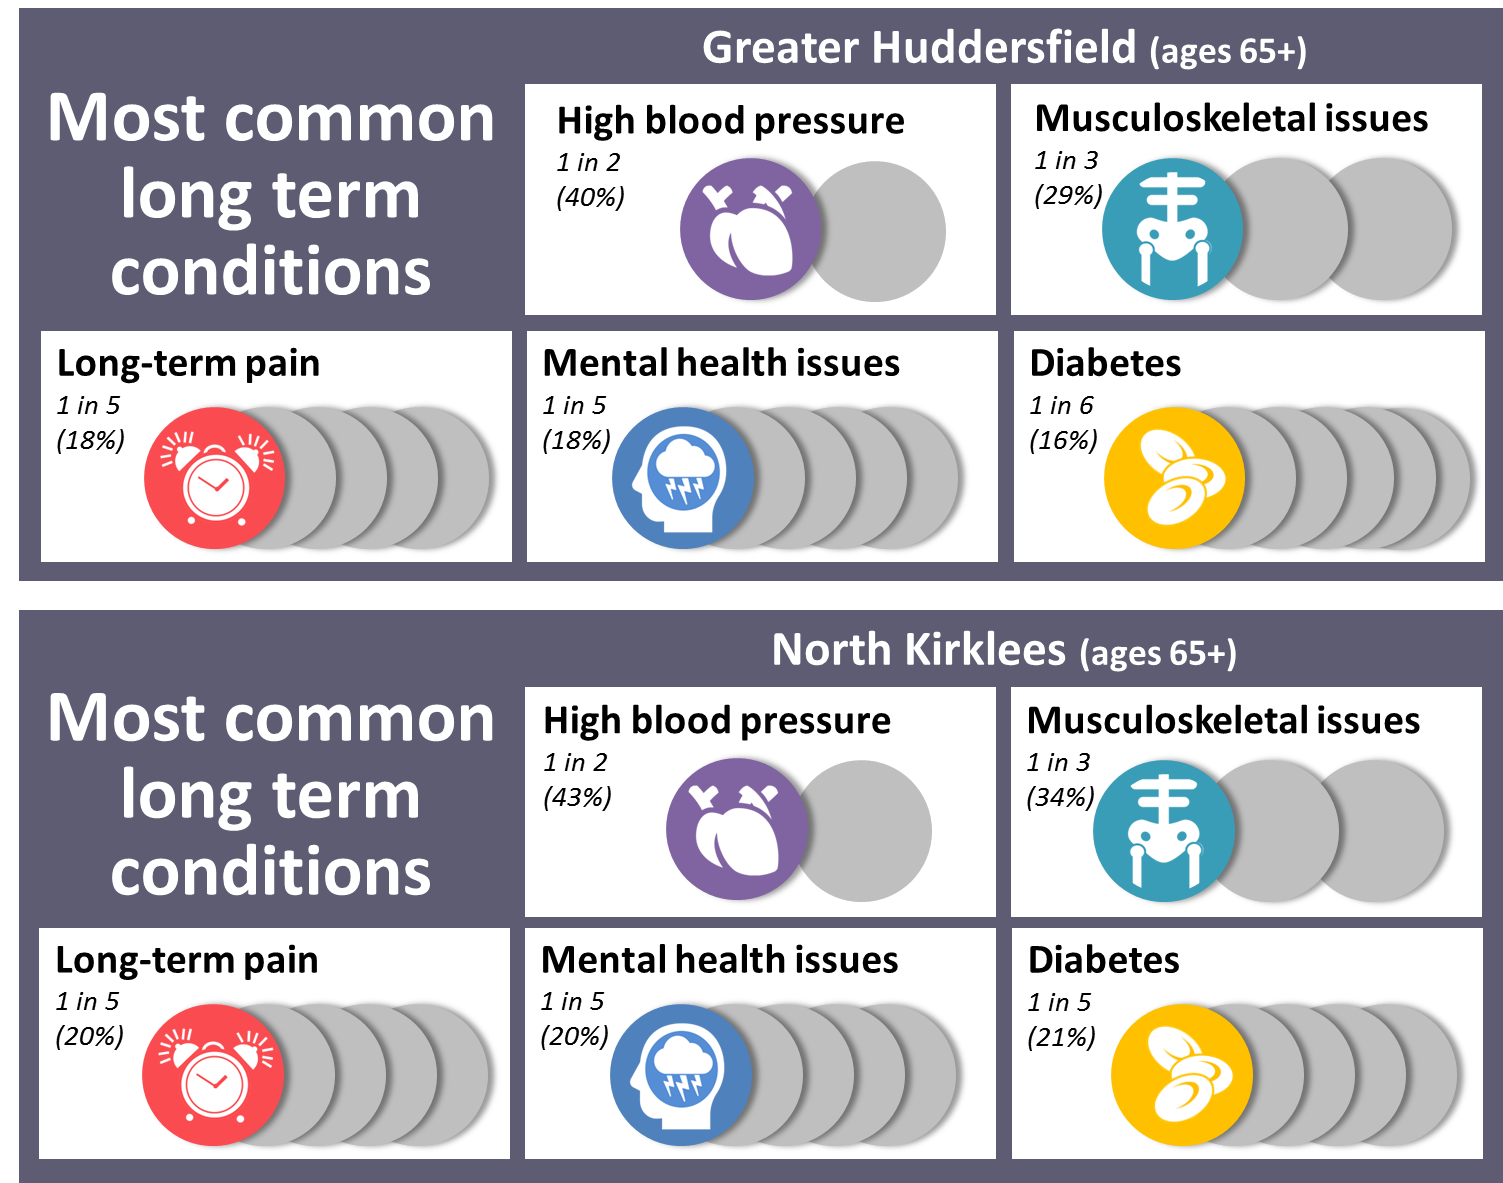
The most common long-term conditions reported by those aged 65 and above are; high blood pressure (43% NK | 40% GH); musculoskeletal issues (34% NK | 29% GH); backache (14% NK | 12% GH); long-term pain (20% NK | 18% GH); mental health issues (20% NK | 18% GH) and diabetes (21% NK | 16% GH). (22)
The only conditions with a lower prevalence in those aged 65+ compared with those aged 18-64 are mental health conditions. (22)
Diabetes
Diabetes is around three times more common in those aged 65+ than those aged 18-64 (21% vs 8% NK | 16% vs 5% GH). (22)
Only around one in ten people who have diabetes aged 65+ have no other conditions (12% NK | 7% GH). The most common concomitant conditions are high blood pressure (54% of diabetics, NK | 62% GH); musculoskeletal issues (39% NK | 34% GH); heart disease (25% NK | 32% GH) and long-term pain (28% NK | 23% GH). (22)
Across all adults, around 59% of people with diabetes say they are accessing support for their condition. This proportion is higher in older adults (65% of those aged 65+ with diabetes, compared with 58% of those aged 18-64); amongst this older age group, the rate is higher in GH than NK (61% NK | 69% GH). (5)
People with diabetes that are accessing support are more confident managing their condition than those not accessing support. For ages 65+, 82% of those accessing support are confident, compared with 66% of those not accessing support. (5)
For a more general review of diabetes in Kirklees, please see the diabetes section.
Cancer
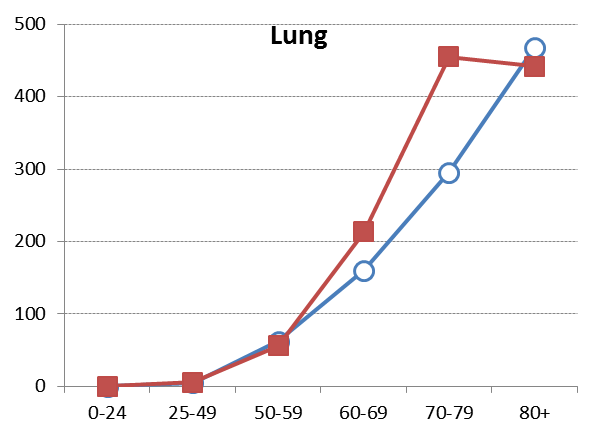
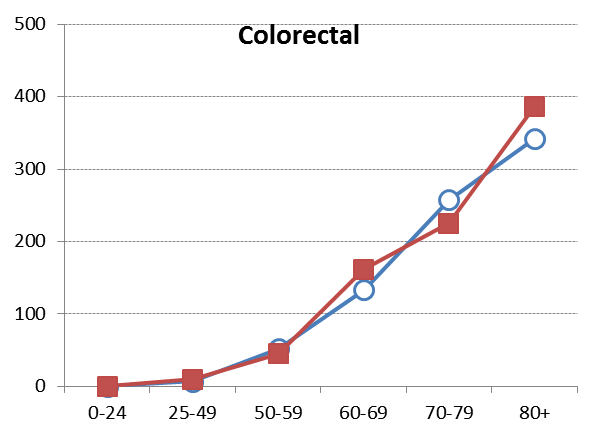
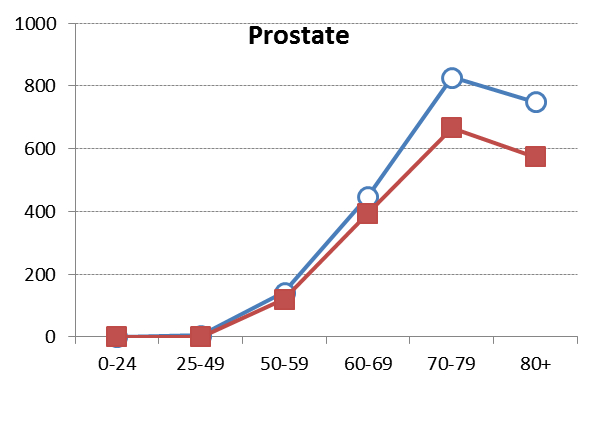
The incidence of all cancer types increases with age, with incidence peaking in age groups aged 60+ (Figure 11). (33)
 |
 |
 |
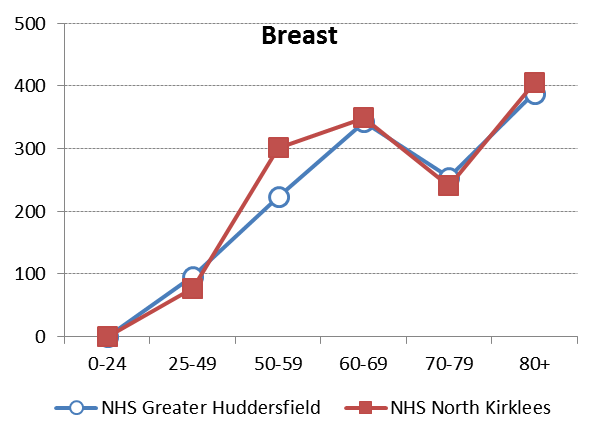 |
| Figure 11: Crude cancer incidence rates per 100,000 by age group and CCG (2012-14). Lung and colorectal are all persons, prostate is males and breast is females Data from: https://www.cancerdata.nhs.uk | |
For a more general review of cancer in Kirklees, please see the cancer section.
Respiratory Conditions
Around one in six people aged 65+ (17% NK | 16% GH) have at least one of the respiratory conditions chronic obstructive pulmonary disorder (COPD) or asthma. (22)
People with respiratory conditions are around twice as likely to be regular smokers than those without respiratory conditions in the 65+ age group (11% vs 7% NK | 9% vs 5% GH). (22)
The proportion of people who report that their respiratory condition results in poor sleep is slightly higher in North Kirklees (28%) compared to Greater Huddersfield (23%). (22)
Across all adults, around 52% of people with asthma are accessing support for their condition. This proportion is slightly higher in older adults (55% of those aged 65+ with asthma, compared with 52% of those aged 18-64); amongst this older age group, the rate is higher in GH than NK (53% NK | 57% GH). (5)
People with asthma that are accessing support are more confident managing their condition than those not accessing support. For ages 65+, 79% of those accessing support are confident, compared with 62% of those not accessing support. (5)
For a more general review of respiratory conditions in Kirklees, please see the asthma and COPD section.
Musculoskeletal issues
Around one in three people aged 65+ report having a musculoskeletal issue, with slightly lower rates in Greater Huddersfield (29%) than North Kirklees (34%). (22)
The same proportion of people described themselves as having mobility issues (34% NK | 29% GH), although only around half of those with musculoskeletal problems also reported mobility issues (52% NK | 50% GH). (22)
Across all adults, around 47% of people with MSK conditions are accessing support for their condition. This proportion is slightly lower in older adults (47% of those aged 65+ with MSK conditions, compared with 48% of those aged 18-64); amongst this older age group, the rate is similar across both CCGs. (5)
The level of confidence in managing their condition amongst people aged 65+ with an MSK problem is similar whether they are accessing support or not (around 77%). (5)
Dementia
One in six people aged 65+ (17% NK | 15% GH) report having an illness or condition which affects their memory. This proportion is slightly higher in males than females (20% vs 13% NK | 15% vs 13% GH). (22)
These self-reported rates of memory problems are far higher than estimated prevalence rates of dementia within each of the CCGs (both of which are 6%). Comparisons between the estimated prevalence and the diagnosed population suggest that around two in three cases of dementia are currently diagnosed (67% in both CCGs). This value is not significantly different from the England average. However, the value is significantly lower than the average value of the five highest out of the ten most similar CCGs (74% for the Greater Huddersfield comparators and 79% for the North Kirklees comparators).(26)(27)
Falls
Comparing the CCGs, a similar proportion of people aged 65+ reported suffering a fall in the last 12 months (26% NK | 27% GH). A slightly higher proportion of falls result in a broken bone in Greater Huddersfield (32% compared to 22% in North Kirklees), although this difference was not significant. (22)
Both CCGs have a rate of recorded fractures in older people of 14.0 per 1000. When compared against the group of 10 other most similar CCGs, North Kirklees has the third highest rate in its comparator group and Greater Huddersfield has the fifth highest rate in its group. (43) (44)
Care, self-care and independence
Age has little effect on confidence in managing own health (86% of those aged 18-64 and of those 65+ are confident they can manage their own health, NK | 89% of those aged 18-64 vs 87% of those 65+, GH). (22)
People aged 65+ are more likely to be accessing support for a long-term condition compared with those aged 18-64, suggesting that this group may be more proactive about managing their health conditions (37% of those aged 18-64 with a LTC are accessing support vs 40% of those aged 65+, NK | 37% for 18-64 vs 44% for 65+, GH). (22)
Females aged 65+are less likely to access support for their LTC than males (37% vs 42% NK | 40% vs 47% GH). (22)
A similar proportion of people aged 65+ have diminished ability to provide self-care (such as washing and dressing themselves) across the two CCGs (9% NK | 8% GH). This may also indicate a reduced ability to undertake the functions necessary to maintain health. (22)
People and place
An individual’s health, emotional wellbeing and quality of life are highly dependent upon wider social and economic circumstances. Factors such as isolation and housing may have pervasive effects that reduce an individual’s ability to manage their own health and respond to illness.
Social connectedness and isolation
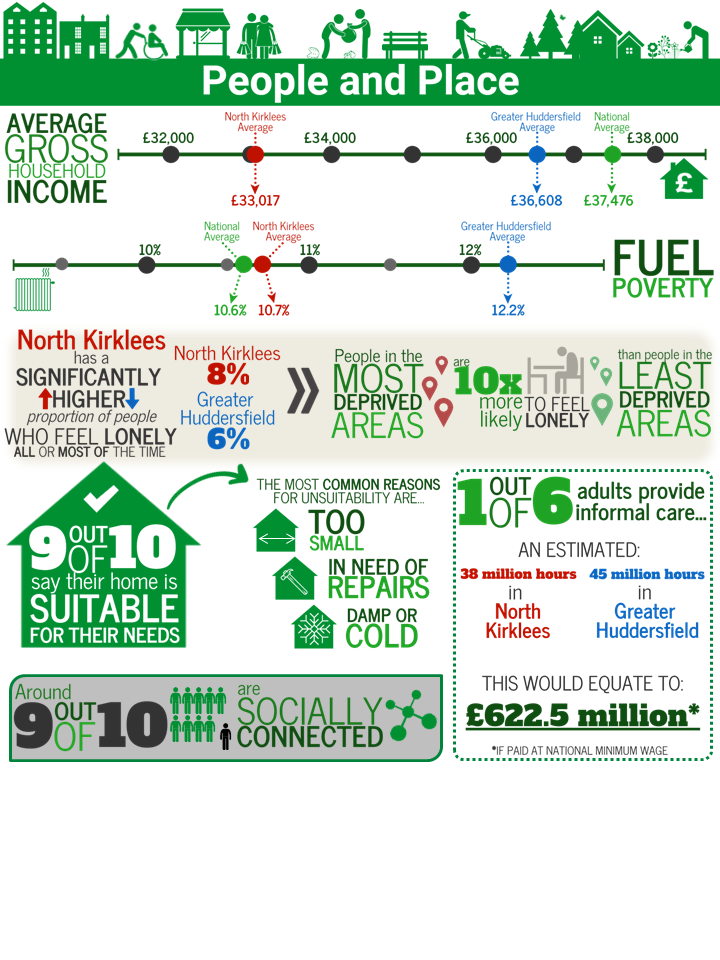
A significantly higher proportion of people report being lonely all or most of the time in North Kirklees (8%) compared to Greater Huddersfield (6%). (22)
Loneliness is highly related to deprivation, with the proportion reporting being lonely all or most of the time around ten times higher in the most deprived groups compared to the least deprived groups (11% vs 1% NK | 10% vs 1% GH). (22)
Around one in ten people report they do not have someone they can rely on in a crisis (9% NK | 8% GH). This value is lower for those over the aged 65+ (5% in both CCGs). (22)
Around nine in ten people are socially connected (defined here as having someone to rely on in a crisis or having someone to provide comfort when upset). Social connectedness is slightly higher for Greater Huddersfield (86% NK | 88% GH) and significantly higher for older adults across both CCGs (91% for ages 65+ | 86% for ages 18-64).
Both CCGs have a statistically significantly smaller proportion of people aged 65+ living alone than the national average (11% NK | 12% GH | 12% England). (26) (27)
For more information please see the Community Cohesion and People Helping People sections
Housing
Around one in 10 people in Kirklees does not believe that their home is suitable for their needs (12% NK | 10% GH). The proportion of people in unsuitable accommodation is highest amongst those aged 25-34 (14%) in Greater Huddersfield and aged 35-44 (18%) in North Kirklees. (22)
Across all ages the most common reasons for the home being unsuitable are: too small (52% NK | 43% GH); in need of repairs (24% NK | 26% GH); damp or cold (19% NK | 20% GH). (22)
People who feel their housing is not suitable for them have lower emotional wellbeing (as measured by SWEMWBS (45)). (22)
Despite a similar proportion of people reporting that their house was cold across the two CCGs, fuel poverty affects more homes in Greater Huddersfield than North Kirklees. In Greater Huddersfield 122 per 1000 households are in fuel poverty compared to 107 per 1000 for North Kirklees. For comparison, the figure for England is 106 per 1000 households (46).
Income and poverty
The average gross household income is higher in Greater Huddersfield (£36,608) than North Kirklees (£33,017). Both values are below the national average (£37,476). (47) For more information please see the Poverty Section.
Carers
One in six people provide some sort of unpaid or informal care to a friend, neighbour or family member (18% NK | 17% GH).
Collectively, carers are estimated to contribute 83 million hours helping friends and family a year (45 million hours in Greater Huddersfield and 38 million hours in North Kirklees). (22)
If carers were paid the national minimum wage for these hours (£7.50 per hour), this would equate to a cost of £337.5 million for Greater Huddersfield and £285 million for North Kirklees. These figures exceed the entire CCG budgets for 2015/16 (£289 million for Greater Huddersfield and £243 million for North Kirklees). For more information please see the Carers section.
Assets
Health assets are those things that enhance the ability of individuals, communities and populations to maintain and sustain health and well-being. These include things like skills, capacity, knowledge, networks and connections, the effectiveness of groups and organisations and local physical and economic resources.
Assets are hugely important to how we feel about ourselves, the strength of our social and community connections and how these shape our health and wellbeing.
As part of our KJSA development we are piloting a range of methods to capture and understand the assets that are active in Kirklees. Please see the assets section for more information about our approach. We want to understand more about how these assets improve health and wellbeing directly or indirectly by, for example, providing space, support, companionship or guidance around a common interest or need such as mental or emotional health problems. This knowledge will help us understand where the gaps in assets might be and where additional support or investment would benefit local communities.
Examples of community assets in Kirklees can be found in the People helping people section.
What could commissioners/service planners/Councillors consider?
Build on existing community assets
It is important that commissioners, service planners and Councillors understand and consider the community assets outlined above, so that they can support and build on local strengths and also understand where there are gaps and unmet needs in particular places or amongst particular communities.
Work with Community hubs and other partnerships/ services
Look for opportunities to support the development of schools as community hubs as described above. There are opportunities to use the hubs as a new context for existing work and also to develop new ideas directly with hubs. The hubs are increasingly becoming a focus for the recommissioning of a range of existing services and provide an infrastructure for sharing intelligence, identifying and responding to local needs.
All service providers – such as schools, GPs, pharmacies, youth services – whose work has an influence on emotional wellbeing and/or sexual health, are encouraged to work alongside the new sexual health services in Kirklees. These have recently been redesigned with an increased focus on prevention of poor sexual health, including closer working with schools and more outreach work in communities.
Support improved health and wellbeing
Support the implementation of the National Diabetes Prevention Programme by increasing awareness and uptake of NHS Health Checks.
Work with communities to raise the programme’s profile and ensure relevant information is disseminated.
Support the Breathe 2025 campaign.
Improve links between all existing services and improve referral pathways to smokefree services and drug and alcohol services.
Create more smokefree environments to protect young people from starting smoking and contribute to de-normalisation of smoking (there are two pilot smokefree play areas in North Kirklees, but none so far in Greater Huddersfield).
Make all council buildings completely smokefree including entrances.
Support CHFT & MYHT to go smokefree and support patients to get smokefree whilst in treatment.
Work with and support local groups and initiatives that are tackling social isolation and suicide prevention, and improving the mental health and emotional wellbeing of vulnerable groups.
For general recommendations around mental health and emotional wellbeing, read this section of the KJSA (http://observatory.kirklees.gov.uk/jsna/specific-conditions/mental-health-emotional-wellbeing)
Support the implementation of the wellness model and the systematic adoption of its approach.
Implementing and embedding the transformational Healthy Child Programme.
References
- NHS Digital. GP registered population [Internet]. 2017 [cited 2017 May 18]. Available from: https://data.gov.uk/dataset/numbers-of-patients-registered-at-a-gp-practice-total
- Office for National Statistics. Census data [Internet]. 2011 [cited 2016 Jul 8]. Available from: https://www.ons.gov.uk/census/2011census/2011censusdata
- Public Health England. Public Health Outcomes Framework [Internet]. 2016 [cited 2016 Sep 30]. Available from: https://fingertips.phe.org.uk/profile/public-health-outcomes-framework
- Department for Communities and Local Government. English indices of deprivation 2015 [Internet]. 2015 [cited 2016 Sep 30]. Available from: https://www.gov.uk/government/statistics/english-indices-of-deprivation-2015
- Office for National Statistics. Birth Summary by District Committee. 2015;
- Office for National Statistics. Subnational population projections for England: 2014-based projections [Internet]. 2016 [cited 2016 Sep 30]. Available from: https://www.ons.gov.uk/peoplepopulationandcommunity/populationandmigration/populationprojections/bulletins/subnationalpopulationprojectionsforengland/2014basedprojections
- Office for National Statistics. Birth Summary Table 2015 [Internet]. 2015. Available from: https://www.ons.gov.uk/peoplepopulationandcommunity/birthsdeathsandmarriages/livebirths/datasets/birthsummarytables
- PHE. Child and Maternal Health Profiles [Internet]. Fingertips. Available from: https://fingertips.phe.org.uk/profile-group/child-health
- CHFT & MYHT. Low Birth Weight 2016/17. 2017.
- Calderdale and Huddersfield Foundation Trust & Mid-Yorkshire Hospitals Trust. Smoking at delivery 2016/17. 2017.
- Calderdale and Huddersfield Foundation Trust & Mid-Yorkshire Hospitals Trust. Breastfeeding at delivery. 2016.
- Calderdale and Huddersfield Foundation Trust & Mid-Yorkshire Hospitals Trust. Breastfeeding at 6 to 8 weeks. 2016.
- PHE – Fingertips. Early Years Health Profiles [Internet]. Available from: http://fingertips.phe.org.uk/child-health-early-years
- Kirklees Council. Children and Young People’s Survey. 2014.
- PHE – Fingertips. Crisis Care Health Profile [Internet]. [cited 2017 Dec 14]. Available from: http://fingertips.phe.org.uk/crisis-care
- Public Health England. Children’s and Young People’s Mental Health and Wellbeing [Internet]. 2016. Available from: http://fingertips.phe.org.uk/profile-group/mental-health/profile/cypmh
- PHE – Fingertips. NCMP Local Authority Health Profiles [Internet]. Available from: https://fingertips.phe.org.uk/profile/national-child-measurement-programme
- Kirklees Council. NCMP Ward Summary.
- Public Health England. Sexual and Reproductive Health Profiles [Internet]. Available from: http://fingertips.phe.org.uk/profile/sexualhealth
- PHE – Fingertips. Young People Health Profiles [Internet]. Available from: http://fingertips.phe.org.uk/child-health-young-people
- PHE – Fingertips. Child Health Overview Health Profiles [Internet]. [cited 2017 Dec 14]. Available from: http://fingertips.phe.org.uk/child-health-overview
- Kirklees Council, NHS Greater Huddersfield CCG, NHS North Kirklees CCG. Current Living in Kirklees Survey. 2016.
- Office of National Statistics. Clinical Commissioning Group Mid-Year Population Estimates – Office for National Statistics [Internet]. 2016 [cited 2017 Feb 17]. Available from: https://www.ons.gov.uk/peoplepopulationandcommunity/populationandmigration/populationestimates/datasets/clinicalcommissioninggroupmidyearpopulationestimates
- NHS Kirklees, Kirklees Council. Current Living in Kirklees Survey. 2012.
- NHS England. Find CCGs Like Mine [Internet]. Learning Enviroment. 2017 [cited 2017 May 5]. Available from: https://www.learnenv.england.nhs.uk/similar
- Public Health England. Commissioning for Value: Long Term Conditions Pack (Greater Huddersfield). 2016.
- Public Health England. Commissioning for Value: Long Term Conditions Pack (North Kirklees). 2016.
- National Cardiovascular Intelligence Network PHE. Prevalence estimates of non-diabetic hyperglycaemia by CCG [Internet]. Public Health England; [cited 2017 Apr 28]. Available from: http://www.yhpho.org.uk/default.aspx?RID=213523
- NICE. Type 2 diabetes : prevention in people at high risk. Nice. 2012;(July).
- Office for National Statistics. Census ethnicity by Ward and DC. 2011.
- NICE. Type 2 diabetes in adults: management. 2015;
- NHS Digital. National Diabetes Audit – 2015-2016: Report 1, Care Processes and Treatment Targets [Internet]. 2016 [cited 2017 May 9]. Available from: http://www.content.digital.nhs.uk/catalogue/PUB23241
- NHS England. CancerData [Internet]. [cited 2017 Apr 28]. Available from: https://www.cancerdata.nhs.uk/dashboard#?tab=Overview
- Public Health England. Fingertips – Cancer Services Profile [Internet]. 2016 [cited 2017 May 5]. Available from: https://fingertips.phe.org.uk/profile/cancerservices/data#page/0/gid/1938132830/pat/46/par/E39000029/ati/19/are/E38000001/iid/91356/age/1/sex/4
- NHS England. NHS RightCare Commissioning for Value Focus Pack, Respiratory (NHS Greater Huddersfield). 2016.
- NHS England. NHS RightCare Commissioning for Value Focus Pack, Respiratory (NHS North Kirklees). 2016;(April).
- NHS England. Commissioning for Value Focus Pack – Mental health and dementia (NHS Greater Huddersfield). 2016.
- NHS England. Commissioning for Value Focus Pack – Mental health and dementia (NHS North Kirklees). 2016.
- Office for National Statistics. Primary Care Mortality Database 2013-15. 2015.
- Public Health England. Inhale – INteractive Health Atlas of Lung conditions in England [Internet]. Fingertips. 2015 [cited 2017 May 9]. Available from: https://fingertips.phe.org.uk/profile/inhale
- Public Health England. ARM local indicators [Internet]. Fingertips. 2016 [cited 2017 May 9]. Available from: https://academic.oup.com/jac/article-lookup/doi/10.1093/jac/dkw536
- Office for National Statistics. Clinical Commissioning Group Mid-Year Population Estimates [Internet]. 2016 [cited 2017 Apr 24]. Available from: https://www.ons.gov.uk/peoplepopulationandcommunity/populationandmigration/populationestimates/datasets/clinicalcommissioninggroupmidyearpopulationestimates
- NHS England. Commissioning for Value Focus Pack – Musculoskeletal conditions; trauma and injuries (Greater Huddersfield). 2016.
- England N. Commissioning for Value Focus Pack: Musculoskeletal conditions; trauma and injuries (North Kirklees). 2016.
- Warwick Medical School. Warwick and Edinburgh Mental Wellbeing Scale [Internet]. 2015. Available from: http://www2.warwick.ac.uk/fac/med/research/platform/wemwbs/
- Department of Energy & Climate Change. 2014 Sub-regional Fuel Poverty [Internet]. 2014. Available from: https://www.gov.uk/government/statistics/2014-sub-regional-fuel-poverty-data-low-income-high-costs-indicator
- Kirklees Council. Mean gross household income profiles [Internet]. 2016. Available from: http://observatory.kirklees.gov.uk/profiles/profile?profileId=133
Additional resources
- NHS England CCG data packs: https://www.england.nhs.uk/rightcare/products/ccg-data-packs/
- Child health profile: http://observatory.kirklees.gov.uk/resource/view?resourceId=4648
- Early Years Profiles: https://fingertips.phe.org.uk/profile-group/child-health/profile/child-health-early-years
- Kirklees Health Profile: http://observatory.kirklees.gov.uk/resource/view?resourceId=4655
- Children and Young Peoples Survey 2014: http://observatory.kirklees.gov.uk/profiles/profile?profileId=277&geoTypeId=73&geoIds=00CZ
- Public health outcomes framework: https://fingertips.phe.org.uk/profile/public-health-outcomes-framework
- Public health outcome framework for children: https://fingertips.phe.org.uk/profile/cyphof
- Public health England fingertips tool: https://fingertips.phe.org.uk/
- North Kirklees Commissioning for value packs: https://www.england.nhs.uk/wp-content/uploads/2016/03/nrth-kirklees-ccg-cfv.pdf
- Greater Huddersfield Commissioning for value packs: https://www.england.nhs.uk/wp-content/uploads/2016/03/nrth-kirklees-ccg-cfv.pdf
- Primary Care Network data and intelligence packs (added November 2019)
Date this section was last reviewed
14/12/17 (OR)