
 Population
Headlines
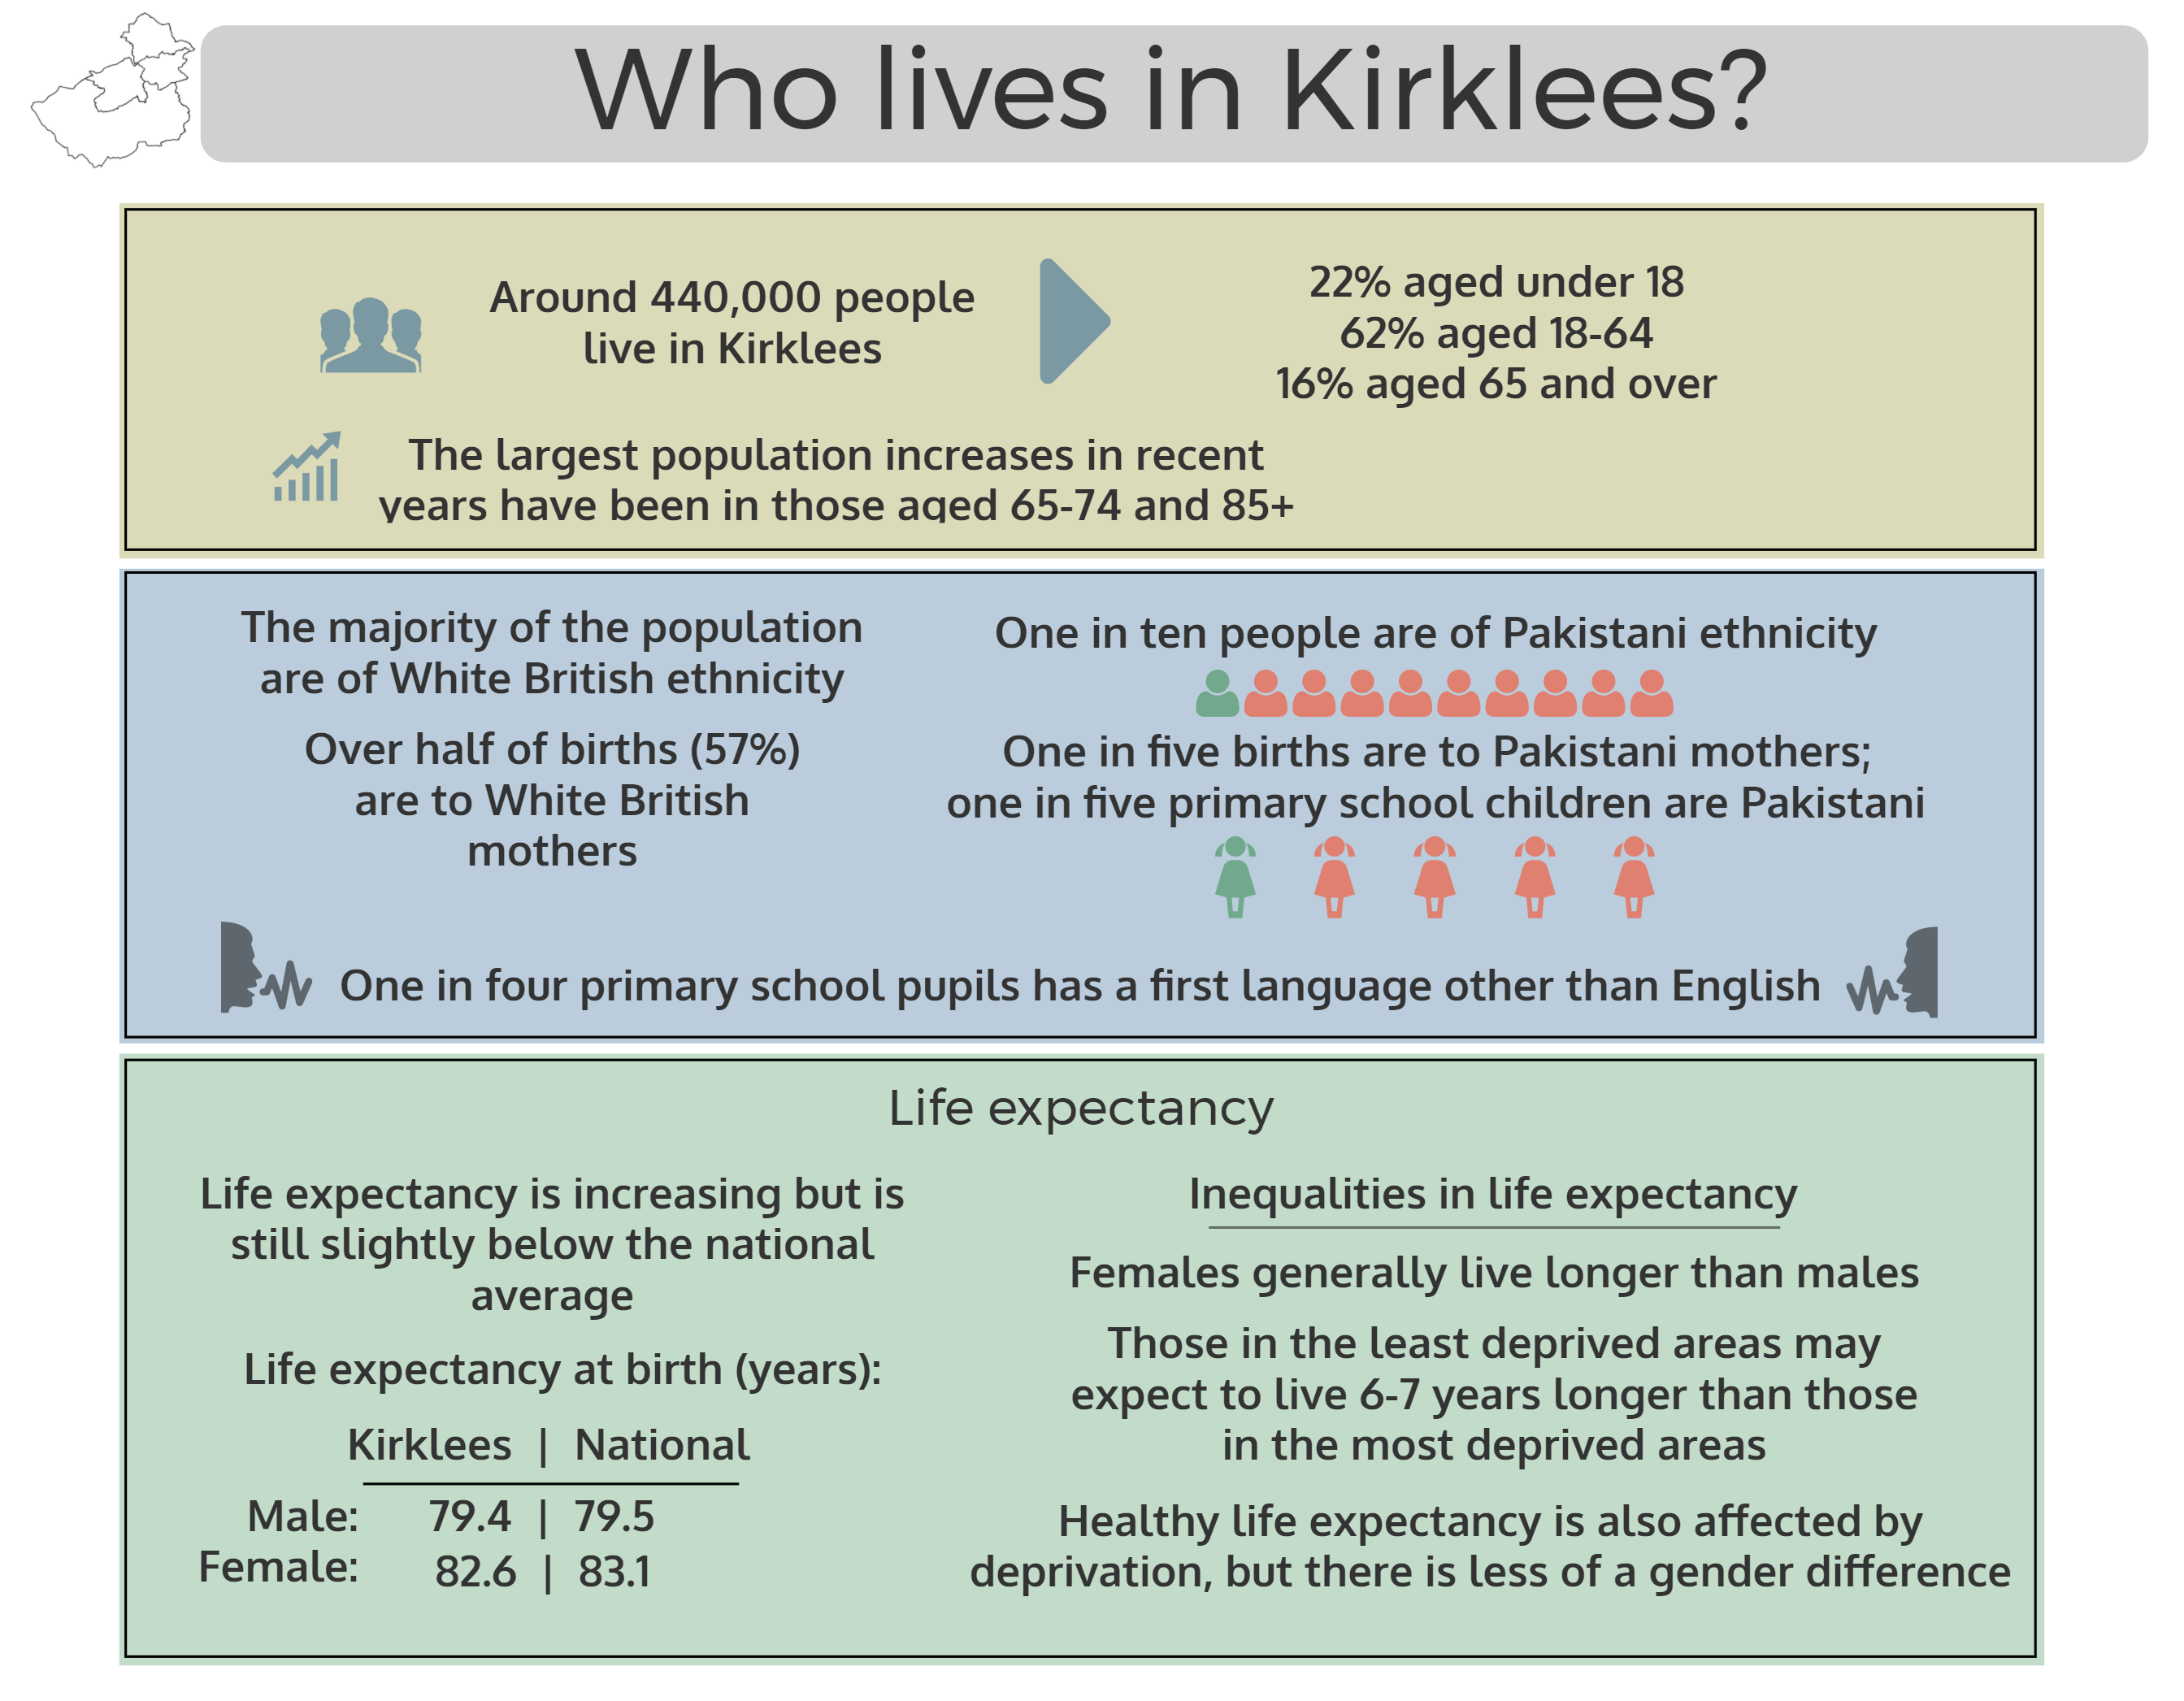
- Around 440,000 people live in Kirklees
- The population has increased by 8.4% since 2002, and is predicted to rise by a further 9.9% by 2030
- Projected increases are largest in very young and older adult age groups
- Over three-quarters of the population are of White British ethnicity
- One in ten people and one in five primary school children are of Pakistani ethnicity
- Life expectancy is increasing but there are inequalities – those in the least deprived areas live longer than those in more deprived areas
- Demand for suitable and affordable accommodation outstrips supply
- The number of households is expected to increase by 20% by 2039
- Around one in five people work in manufacturing (more than double the rate for England)
- More than two thirds of workers live and work in Kirklees
- Although fertility rates are declining, they are still higher than the England average
- Infant mortality rates have almost halved in the last 10 years, but are still amongst the highest in the region
- Mortality rates for under 75-year-olds are higher than national averages for cardiovascular and respiratory disease
- Asylum seekers and European economic migrants are contributing to the emergence of new communities within Kirklees
Introduction
Around 440,000 people live in Kirklees (GP registrations January 2015), with roughly equal numbers of males and females. Kirklees has a varied population – many ethnicities are represented, speaking a range of languages and bringing a cultural diversity to the region. A thriving student community based around the University of Huddersfield attracts students from around the world. Life expectancy and healthy life expectancy (the number of years lived in good health) are increasing across Kirklees.
Kirklees contains areas of high and low deprivation, with regions of highest deprivation found in some of the more densely populated urban areas to the north and east (including parts of Huddersfield, Dewsbury and Batley), and lower levels of deprivation found in the more sparsely populated rural areas to the south and west (including the Colne and Holme Valleys, Denby Dale and Kirkburton).
Population projections to 2030 from the Office for National Statistics (ONS) predict greater increases in the numbers of very young children and older adults (particularly those aged over 64), leading to a relatively smaller working age population supporting a larger dependent population. As the number of people with multiple long-term health conditions increases with age, a projected ageing population is likely to lead to a greater demand on resources.
Summaries for each of the four District Committee areas in Kirklees can be found here:
Batley and Spen | Dewsbury and Mirfield | Huddersfield | Kirklees Rural
Who lives in Kirklees?
Age structure
Table 1 shows the Kirklees population by age group for 2002 and 2015, based on GP registrations. The largest increases in population over this time have been in those aged 65-74 (a 29% increase between 2002 and 2015), which may be partly attributable to those babies born in the post Second World War ‘baby boom’ moving into this age bracket.
| Table 1: GP registered population counts by age, 2002 and 2015 |
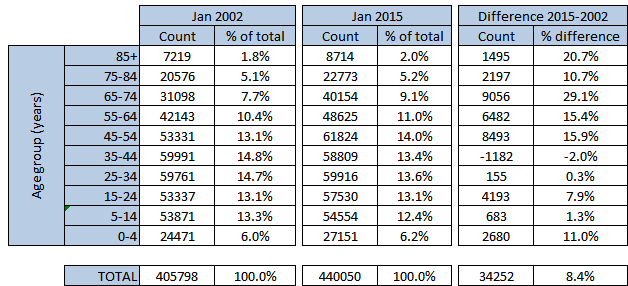 |
Figure 1 shows a more detailed breakdown in population by age and sex for 2015, with 2002 figures provided for comparison.
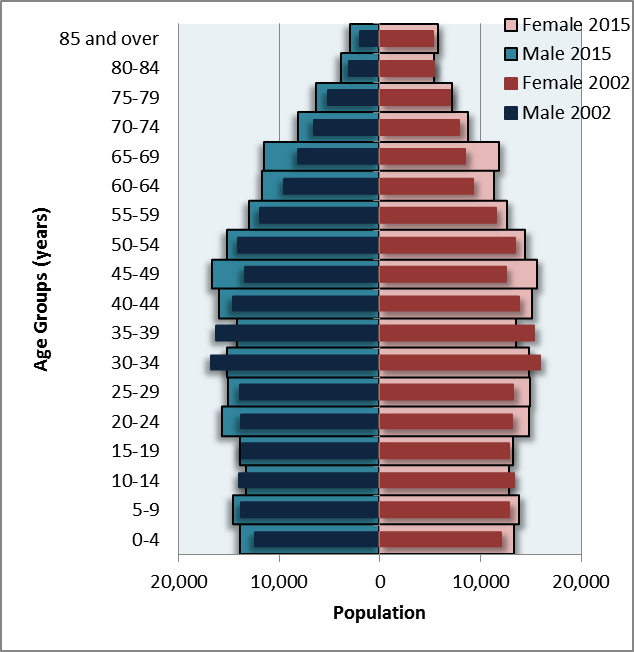 |
| Figure 1: GP registered population in Kirklees, 2002 and 2015 (Source: West Yorkshire Central Services Agency, WYCSA) |
Population pyramids for individual Kirklees wards and years (2002-2015) can be found here.
Figure 2 shows the proportion of the population in each Lower-layer Super Output Area (LSOA) in each of three age bands: 0-15 year olds, 16-64 year olds and ages 65+. Working age people tend to live closer to urban areas and older people tend to live in more rural parts of Kirklees. Higher proportions of 0-15 year olds around Dewsbury and Batley may be indicative of higher birth rates in these areas.
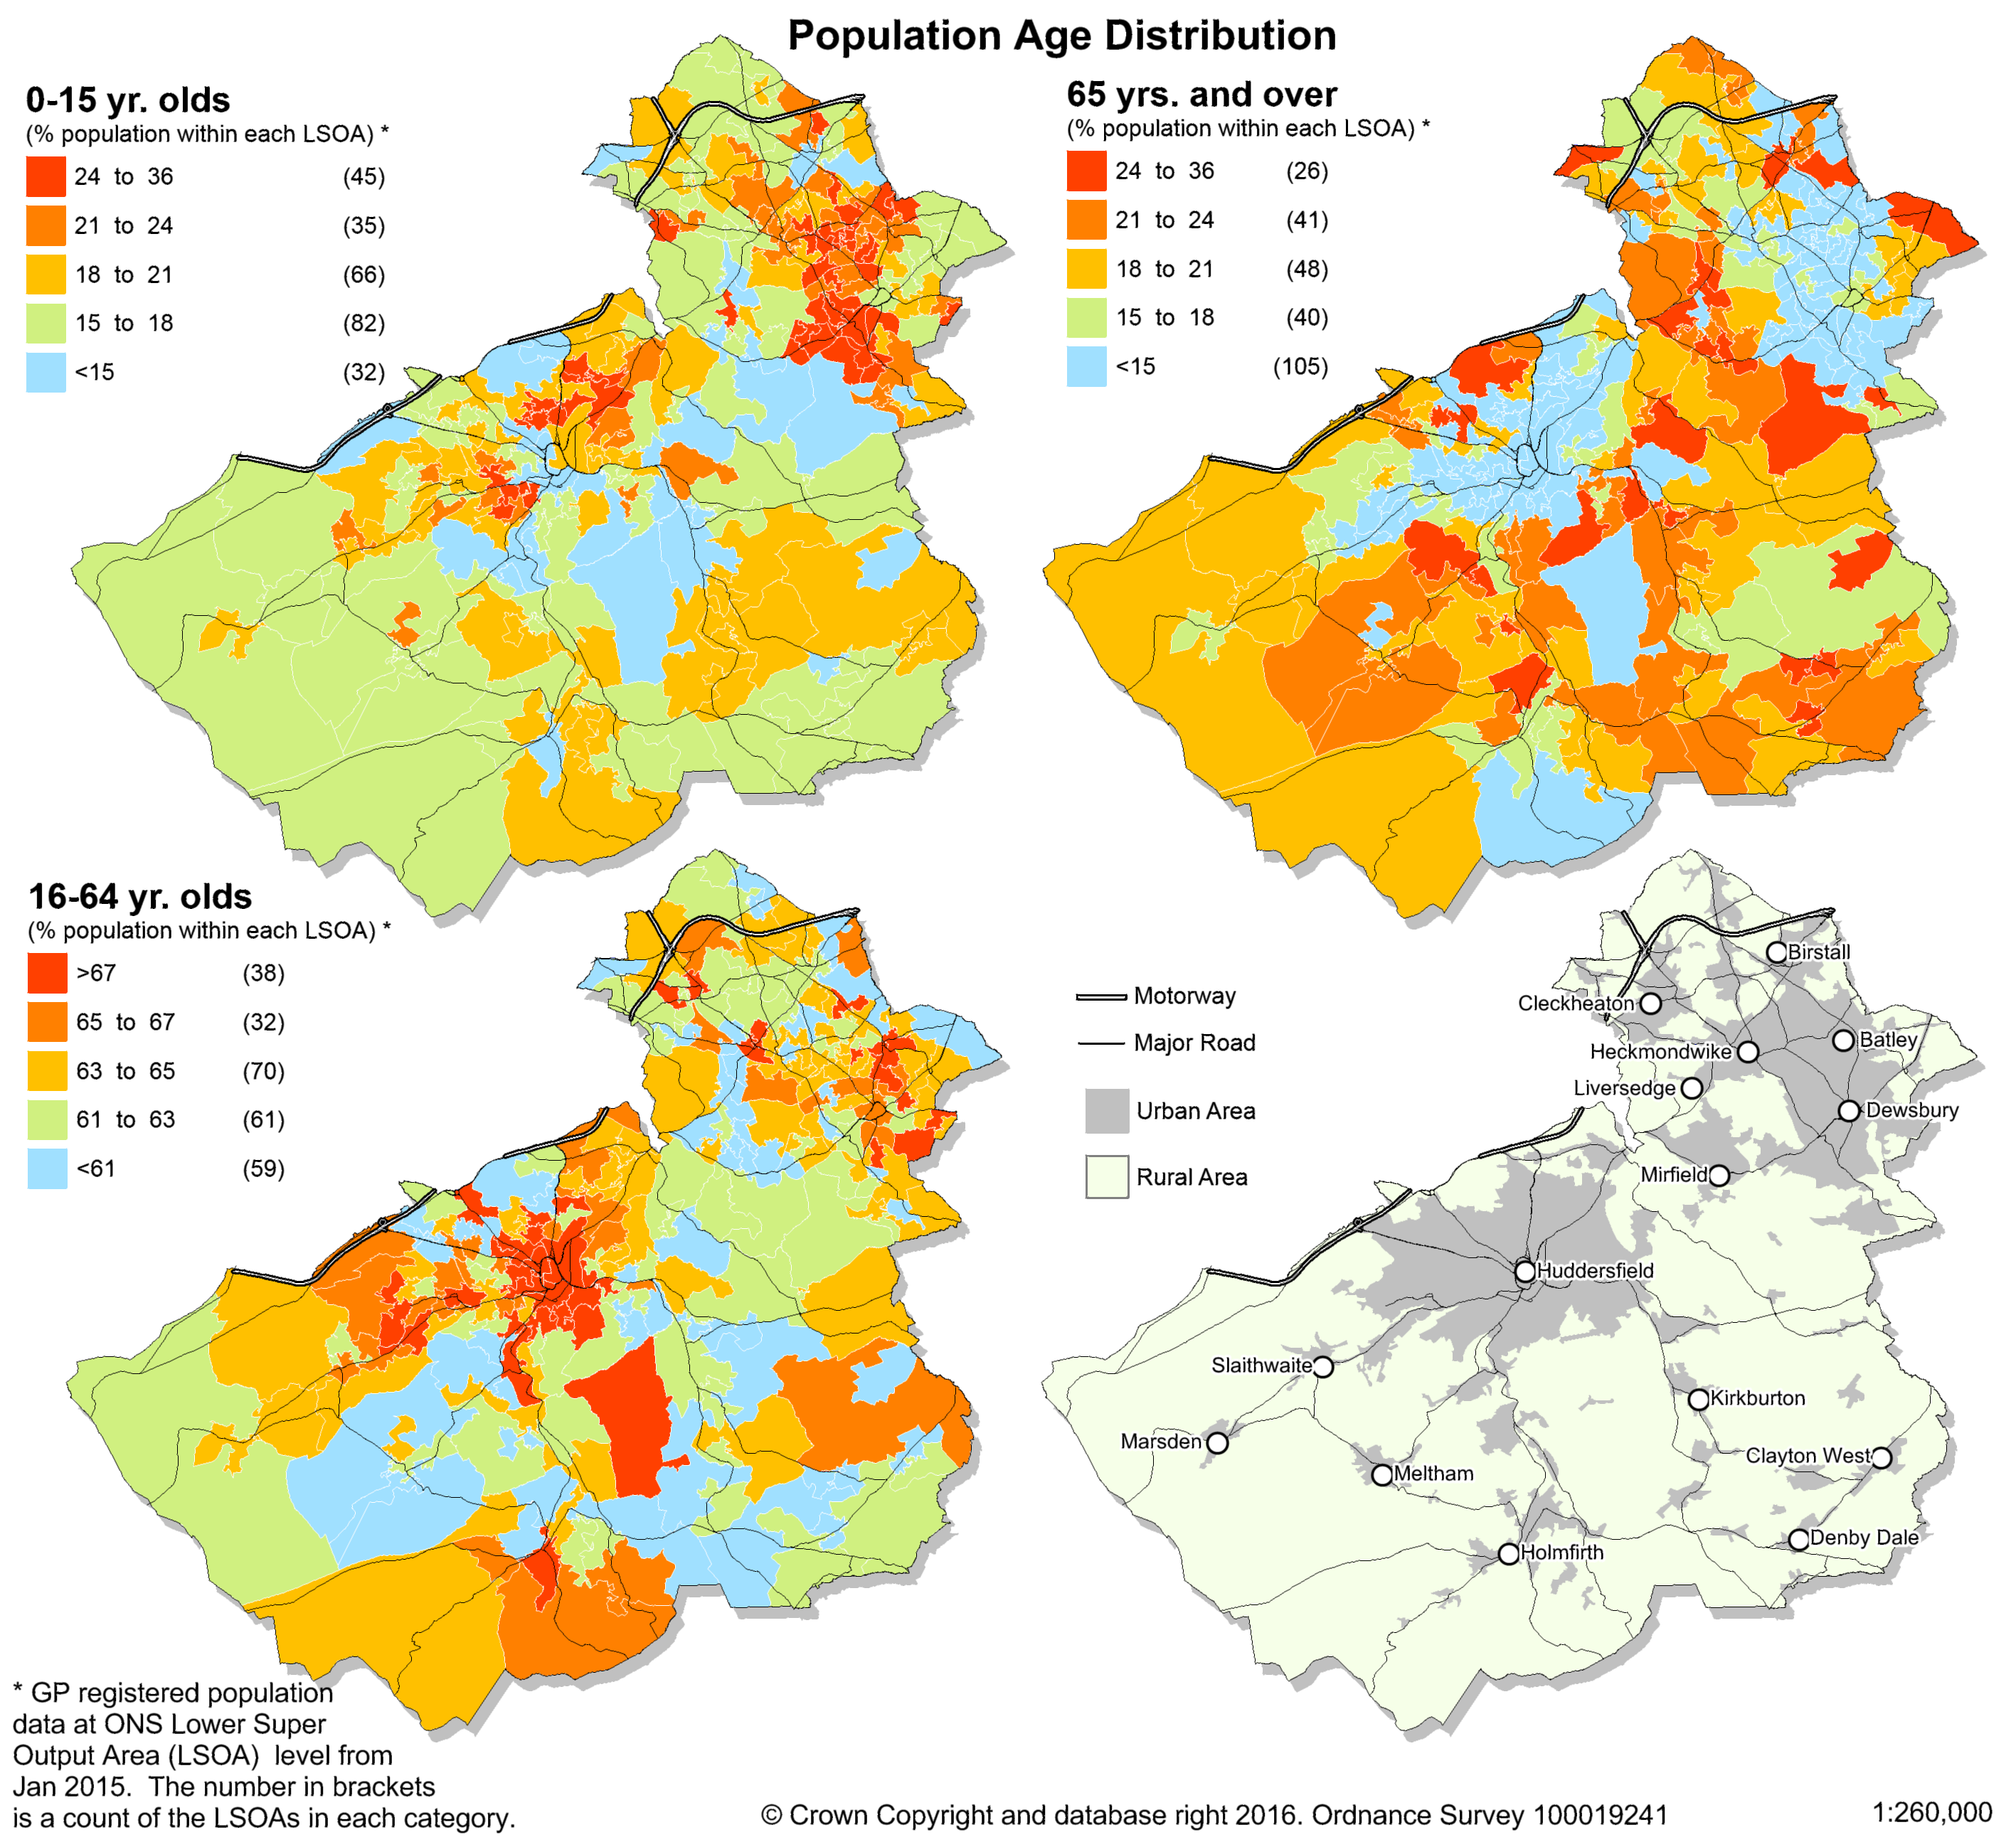 |
| Figure 2: Age distribution of 2015 GP registered population (Source: WYCSA) |
2011 census data has been mapped by single year of age on the Datashine web site (1).
Ethnicity and language
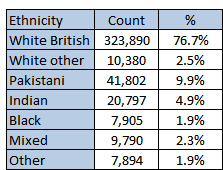
Ethnicity figures from the 2011 census (2) show that more than three quarters of the Kirklees population are White British (Table 2).
| Table 2: Kirklees population by ethnic group (2011 census, ONS) |
 |
Plotting the distribution of ethnic groups across the region a clustering of black and minority ethnicities (BME) can clearly be seen, particularly in areas of Huddersfield, Dewsbury and Batley (Figure 3).
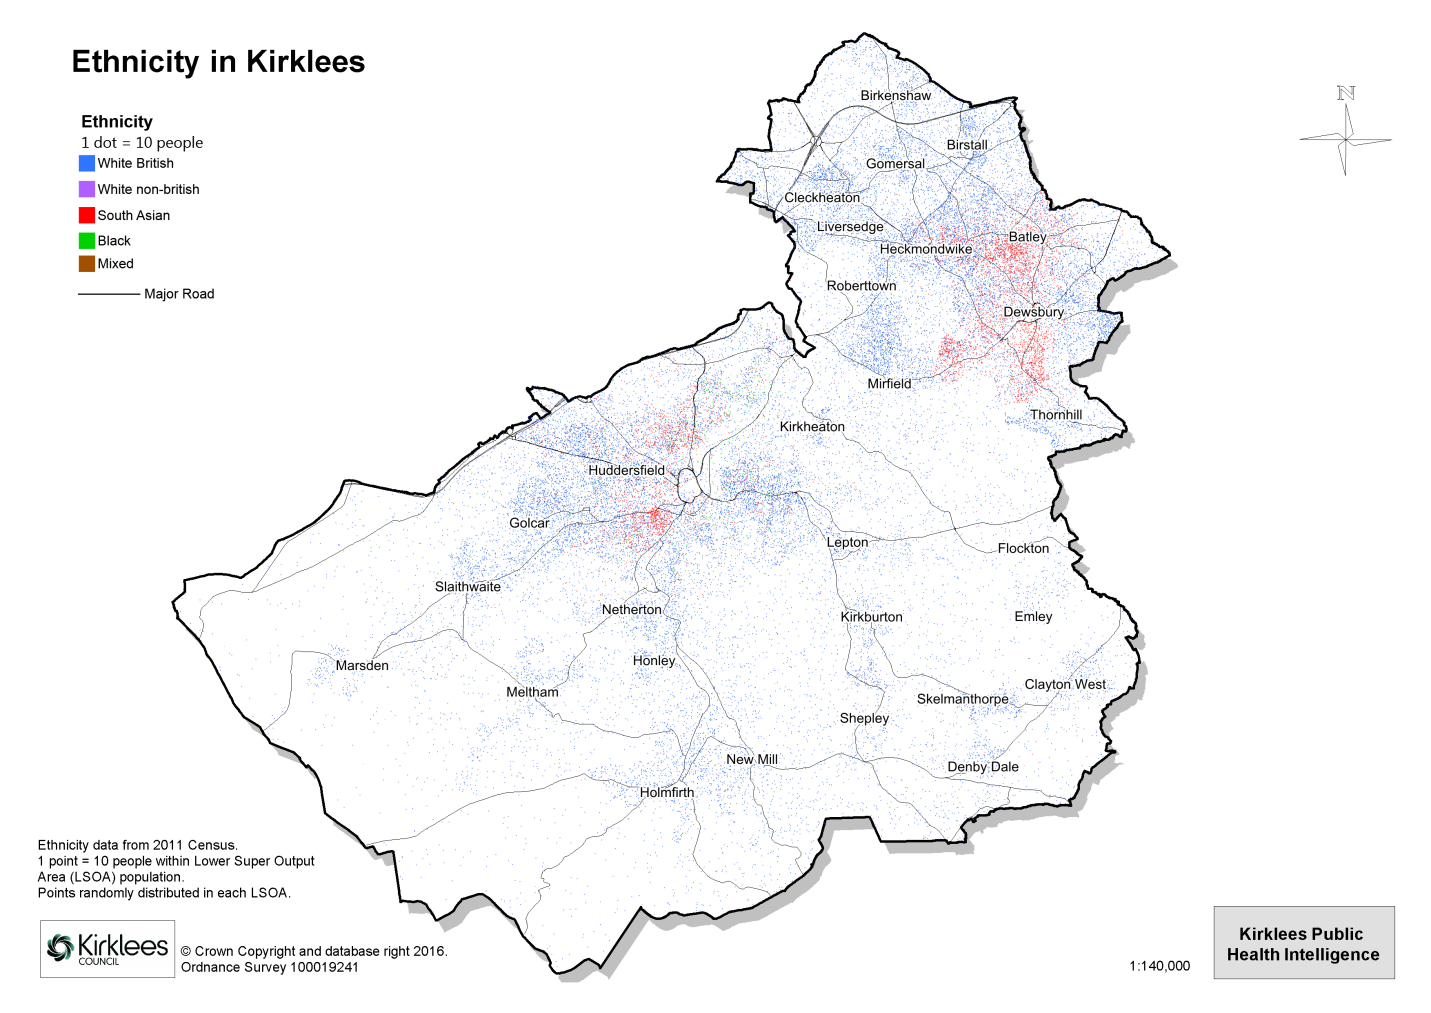 |
| Figure 3: Ethnicity distribution for largest ethnic groups in Kirklees (2011 Census) |
2011 census data has been mapped by ethnic group on the Datashine web site (1).
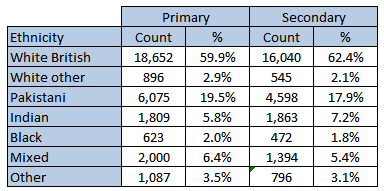
The census of state-funded schools (3) shows that more than a third of Kirklees school children are from BME groups (Table 3). Whereas one in ten people across Kirklees are of Pakistani ethnicity, around one in five primary school pupils are Pakistani. In recent years, the proportion of White British pupils has decreased and the proportions of Pakistani and White non-British pupils have increased (Figure 4).
| Table 3: Pupil ethnicity at state-funded Kirklees schools (Jan 2016 school census) |
 |
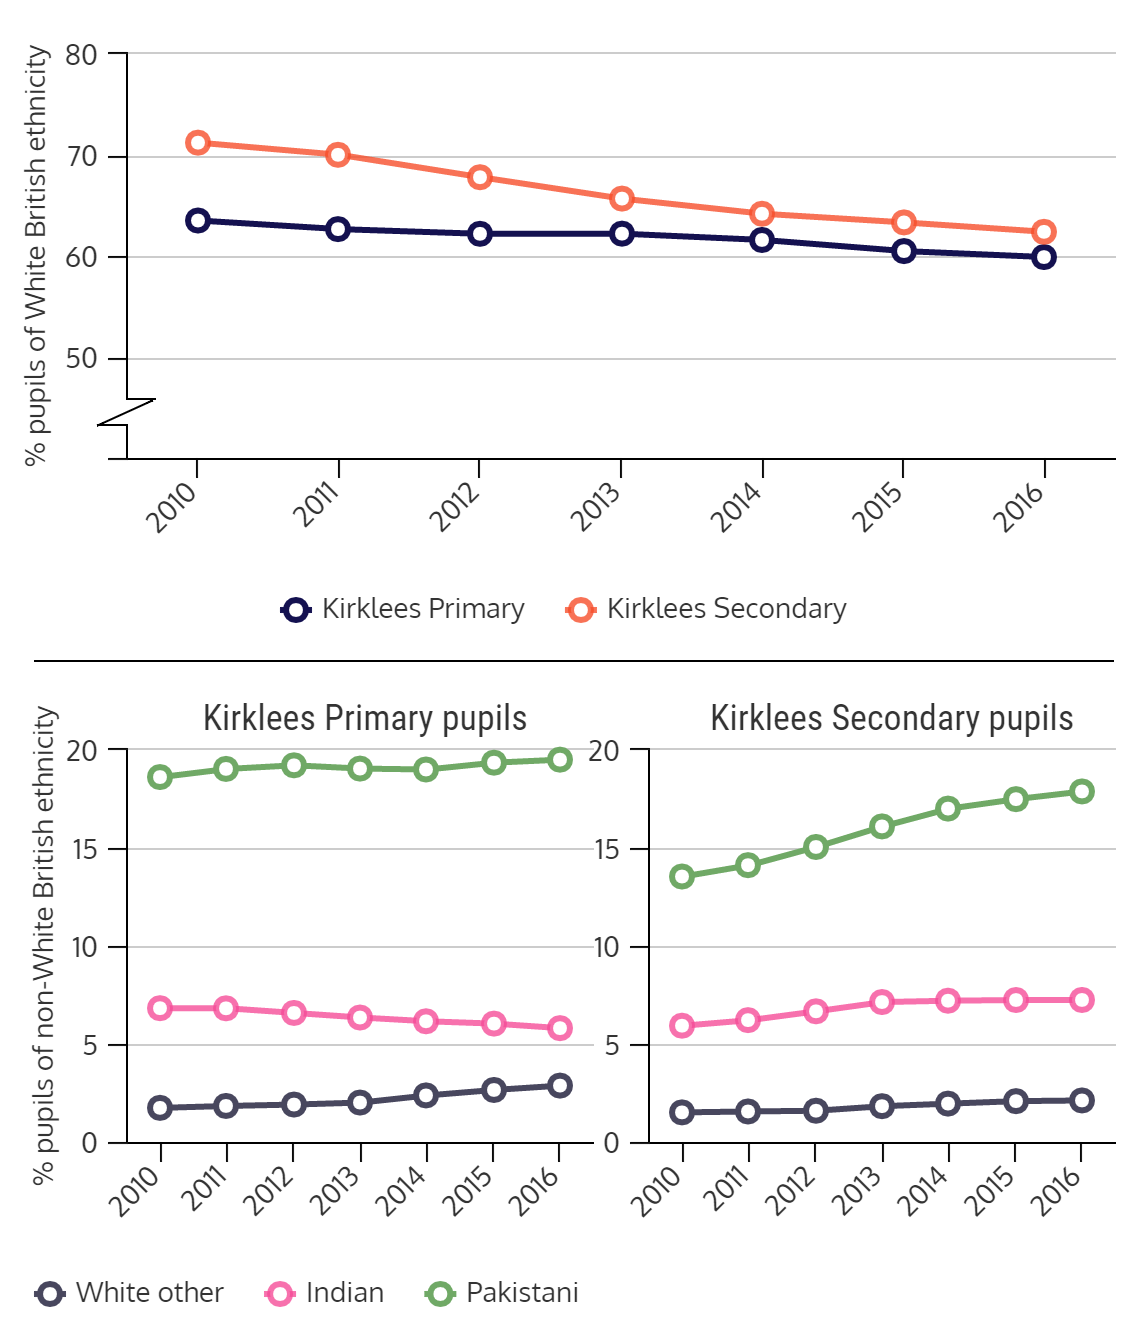 |
| Figure 4: Ethnicity of pupils at Kirklees state-funded schools 2010-2016 (Source: Department for Education school census) |
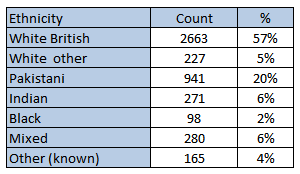
Birth data collected by the two NHS Trusts in Kirklees shows slightly higher proportions of mothers of Pakistani and White non-British ethnicities than the ethnic profile of Kirklees pupils (Table 4). While the proportion of births to Pakistani mothers has remained consistent in recent years, the proportion of births to White non-British mothers is increasing (Figure 5).
| Table 4: Mother’s ethnicity, births in 2015/16 (Kirklees residents) |
 |
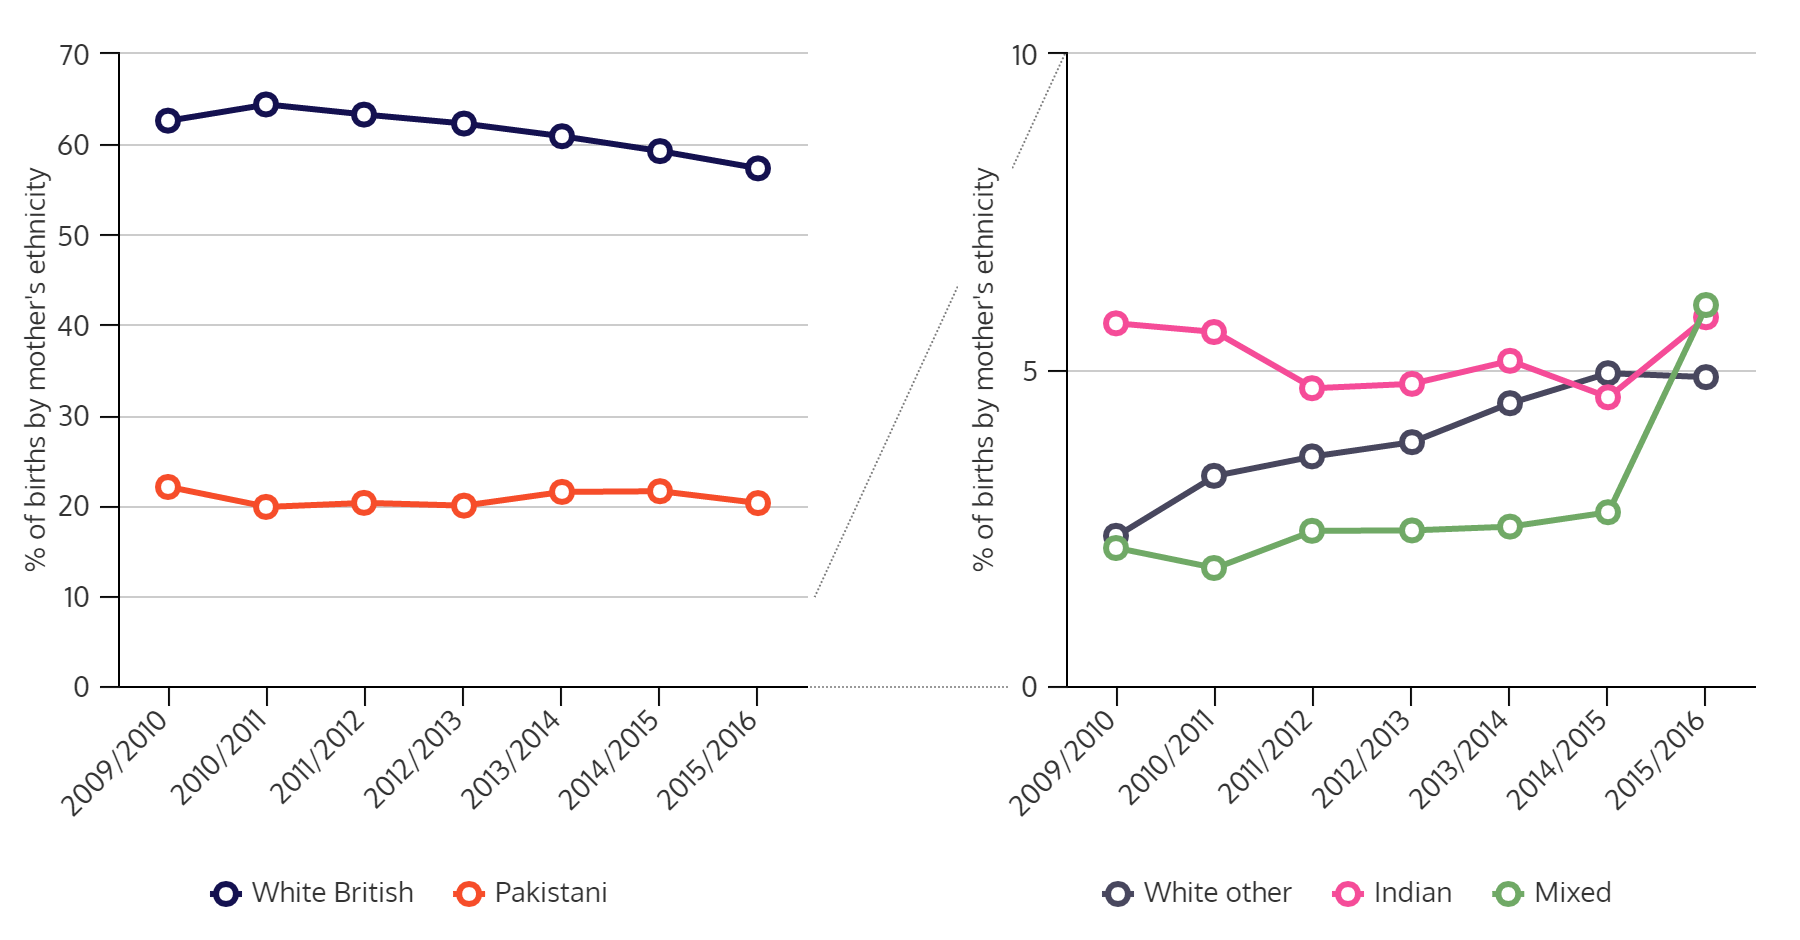 |
| Figure 5: Mother’s ethnicity, births to Kirklees residents 2009/10-2015/16 (Source: CHFT, MYHT) |
From the above information, it is clear that the ethnic profile of Kirklees is changing. Ethnic minority groups tend to be younger and have more children.
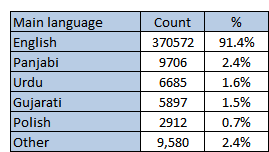
Where minority groups have a limited grasp of the English language, this may be a barrier to accessing services and understanding the advice or support provided. According to the 2011 census (2), 91% of the Kirklees population (aged 3+) has English as their first language (Table 5).
| Table 5: Main language of Kirklees residents (2011 census) |
 |
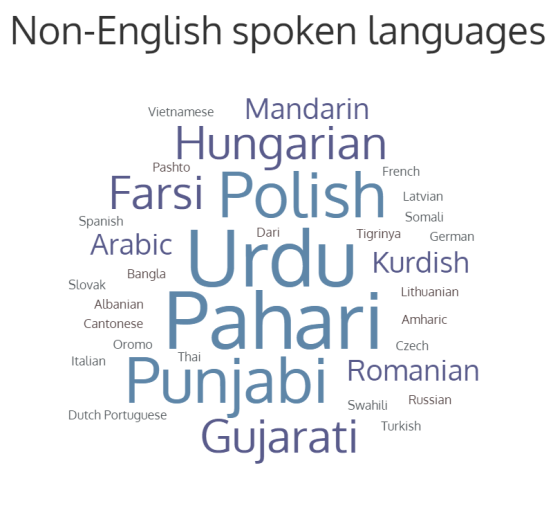
These non-English languages are reflected in the support provided by Kirklees Council’s language service.
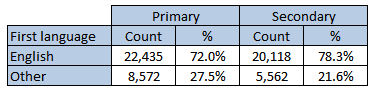
According to the census of state-funded schools (3), one in four primary school pupils and one in five secondary school pupils have a first language other than English (Table 6).
| Table 6: First language for pupils at state-funded Kirklees schools (Jan 2016 school census) |
 |
Protected characteristics
The Equality Act 2010 (4) was created to consolidate current legislation around discrimination. The Act defines nine protected population characteristics that must be considered when striving for equality (5). Where possible, headline figures for each protected characteristic have been taken from local or national data sources and summarised below.
Age
See demographic breakdown above.
Disability
A person has a disability if they have a physical or mental impairment which has a substantial and long-term adverse effect on their ability to carry out normal day-to-day activities.
From the 2016 Current Living in Kirklees (CLiK) adult population survey (6), 13% of respondents said they had a physical or mental health condition which has lasted or is expected to last 12 months or more and reduces their ability to carry out day-to-day activities a lot. Applying this percentage to the 2015 adult population, this would equate to around 43,300 adults in Kirklees.
See also the KJSA section covering disabled people.
Gender reassignment
There is currently limited local information about the number of transgender people living in Kirklees. A small proportion (less than 0.1%) of the 2016 CLiK population survey sample identified themselves as transgender (6); applying this proportion to the adult population suggests there may be around 250 transgender people living in Kirklees.
Marriage and civil partnership
According to the 2011 Census (ONS) (2), just under half of those aged 16 or over in Kirklees are married (48%, 162,938 people). An additional 809 adults aged 16 or over are in a registered same-sex civil partnership, and a total of 109,072 people (32% of those aged 16 or over) are single (never married/never registered a same-sex civil partnership).
Pregnancy and maternity
See the births section below and the separate Pregnancy and infancy section.
Race
See demographic breakdown above and migration section below.
Religion and belief
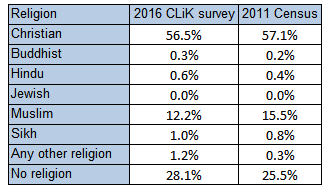
According to the 2016 CLiK adult population survey (6) the two most common faith types in Kirklees are Christian (including Church of England, Catholic, Protestant and all other Christian denominations) and Muslim. The 2011 census (2) found a higher proportion of Muslims in Kirklees than the CLiK survey (Table 7).
| Table 7: Kirklees population by religion (% of total answering question) (Source: 2016 CLiK survey, 2011 census) |
 |
The spatial distribution of population by religion can be found on the Datashine web site (1).
Sex
See demographic breakdown above.
Sexual orientation
According to the 2016 CLiK population survey (6), 96.5% of adults selecting a defined category described their sexual orientation as heterosexual, 1.2% of men and 2.1% of women (1.7% overall) defined themselves as bisexual and 2.4% of men and 1.3% of women (1.8% overall) defined themselves as gay/lesbian.
These numbers are slightly higher than national figures from the National Survey of Sexual Attitudes and Lifestyles (2010-12) (9), where 1.0% of men and 1.4% of women defined themselves as bisexual and 1.5% of men and 1.0% of women defined themselves as gay/lesbian.
Some of the issues faced by lesbian, gay, bisexual and transgender (LGBT) people in Kirklees are highlighted in a 2010 qualitative research report (7).
The PEARLS (Person-based Evidence And Real Life Stories) (8) series of documents summarise findings from local qualitative studies, including issues relating to the LGBT population.
The Inequalities section of the KJSA explores the extent to which health-related outcomes of people in protected characteristic groups may be affected.
A further breakdown of the Kirklees population by some of these protected characteristics (including disability, religion and sexual orientation) can be found in the equality and diversity profile on the Kirklees Observatory.
For details of Kirklees Council’s strategy around inclusion and diversity, click here.
Life expectancy
Life expectancies in Kirklees are slightly lower than national figures, with male and female life expectancy at birth at 79.4 and 82.6 years, respectively (Table 8). In the last 11 years, male and female life expectancies in Kirklees have increased by 3.1 and 2.5 years, respectively.
| Table 8: Life expectancy in Kirklees |
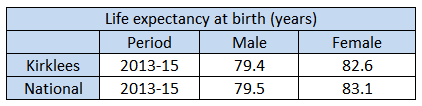 |
| Source: Kirklees mortality from Primary Care Mortality Database, Kirklees population from GP registrations (Jun 2014); National figures from Public Health England (10) |
Although life expectancy is increasing, there are inequalities in life expectancy between areas of low and high deprivation. Figure 6 shows life expectancy at ward level (latest figures and 11-year change in life expectancy), against a background of deprivation quintile (a comparative indicator of deprivation level relative to other areas of England, the 2015 Index of Multiple Deprivation (11)).
 |
| Figure 6: The variation of life expectancy and deprivation across Kirklees (Source: Kirklees mortality from Primary Care Mortality Database, Kirklees population from GP registrations) |
Males living in areas of Kirklees defined as being amongst the least deprived 20% in England have a life expectancy 6.8 years longer than those in the most deprived 20% (Figure 7). Females in the least deprived quintile have a life expectancy 5.3 years longer than those in the most deprived quintile.
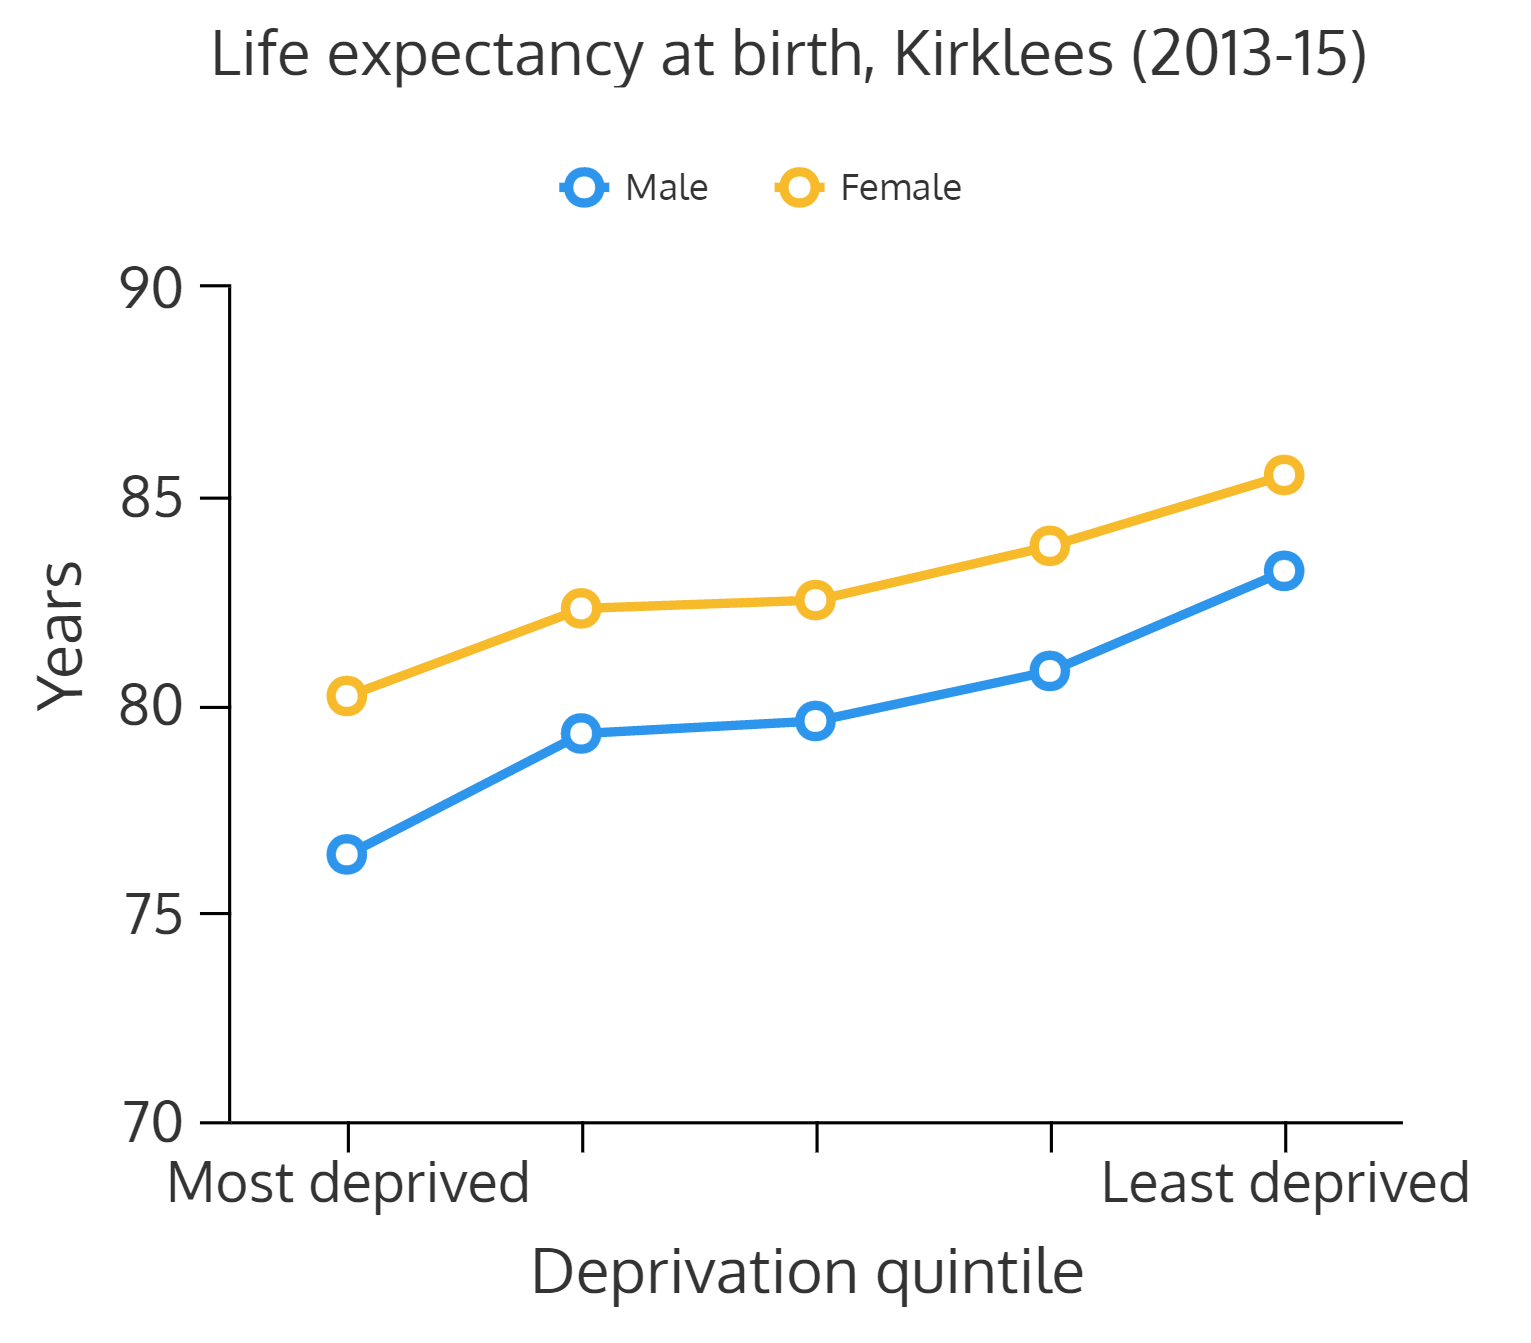 |
| Figure 7: The social gradient for life expectancy |
Analysis by Public Health England (using ONS death registration data, mid-year population estimates and the Index of Multiple Deprivation 2015) (12) suggests that the largest contributors to differences in life expectancy between the most deprived and least deprived areas in Kirklees are circulatory disease , cancer and respiratory disease (Table 9 and Figure 8).
| Table 9: Contribution to life expectancy gap between most deprived and least deprived quintiles in Kirklees, by broad cause of death, 2012-2014 |
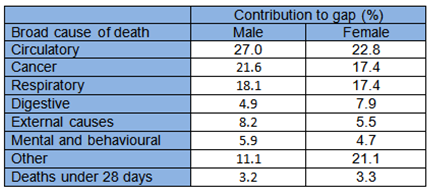 |
| Source: PHE Life Expectancy Segment Tool (12) |
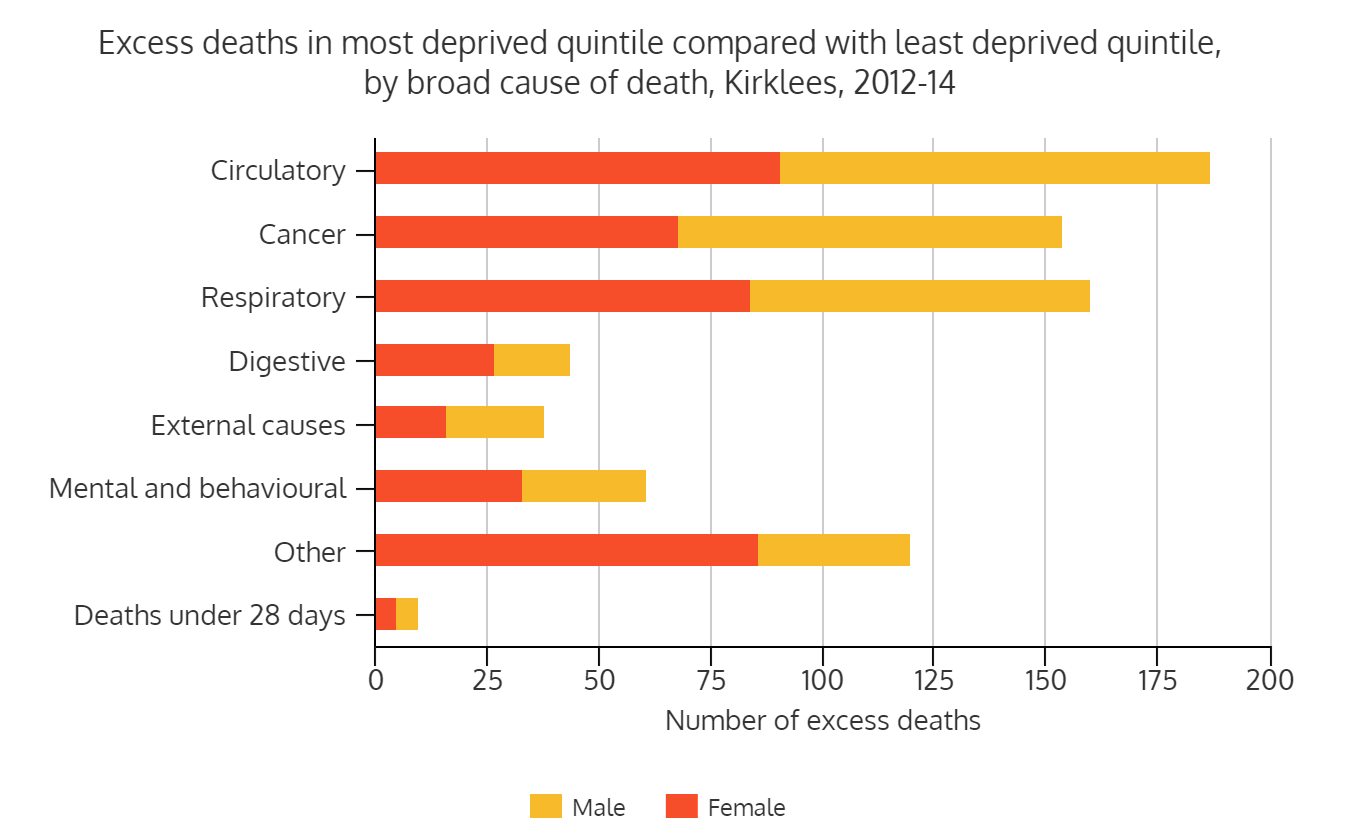 |
| Figure 8: Excess deaths in most deprived quintile compared with least deprived quintile (Source: PHE Life Expectancy Segment Tool (12)) |
Healthy life expectancy (the number of years lived in good health) is similar for males and females (62.3 and 61.8 years, respectively) (Table 10 and Figure 9). This suggests that although females generally live longer than males, those additional years may be lived in poor health.
| Table 10: Healthy life expectancy at birth in Kirklees |
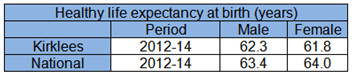 |
| Source: Public Health Outcomes Framework (PHOF) (10) |
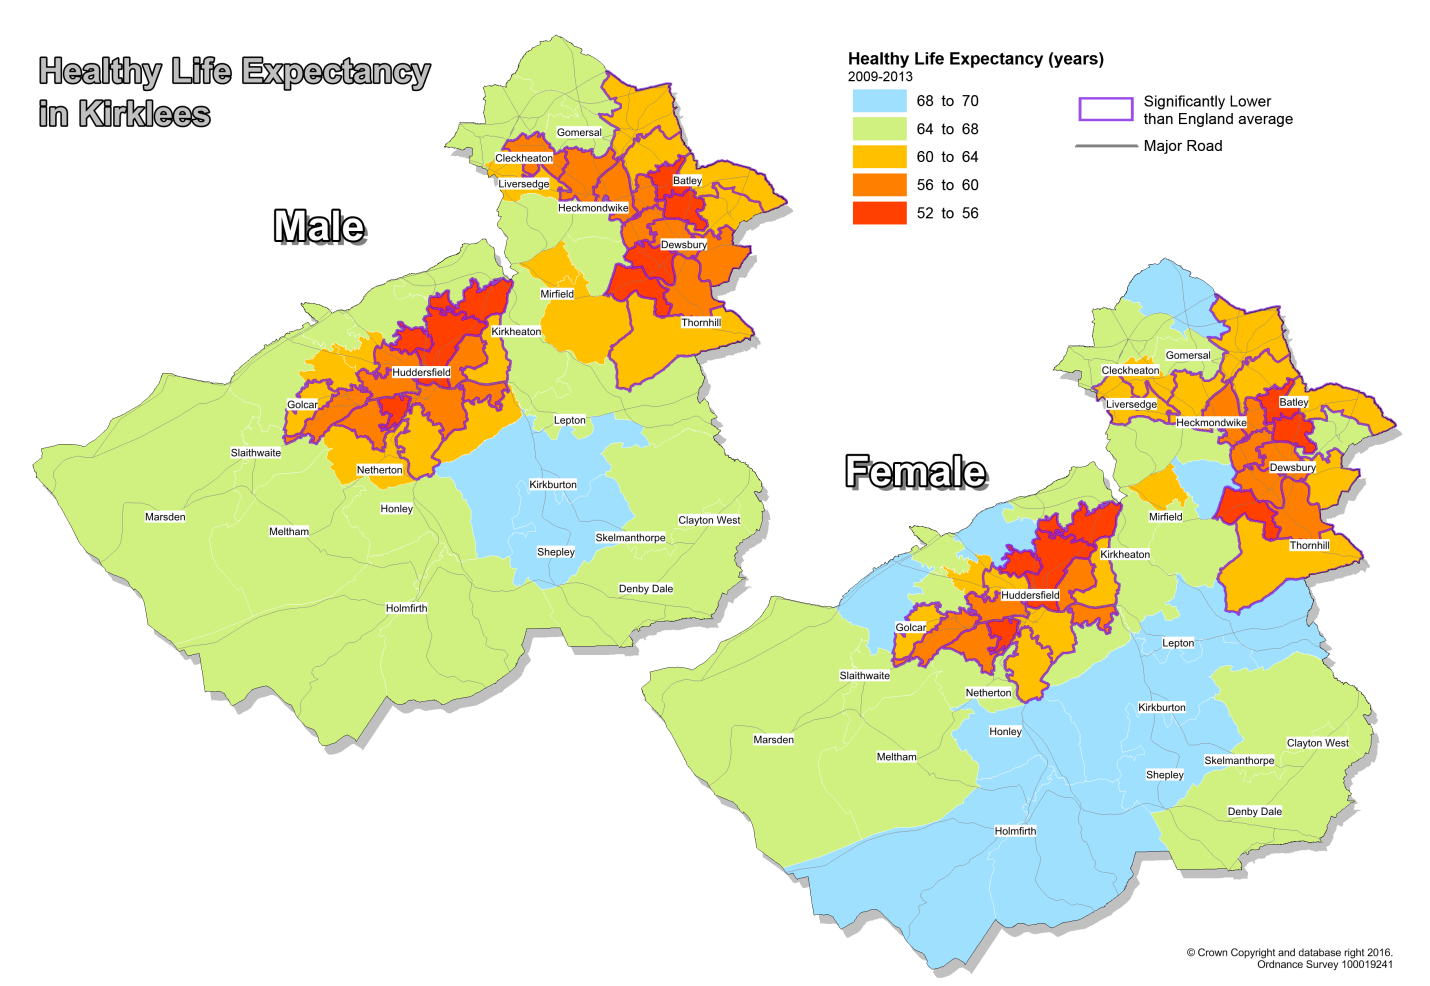 |
| Figure 9: Healthy life expectancy in Kirklees, 2009-2013 (Source: PHOF (10)) |
Healthy Foundations motivation segments
The Healthy Foundations segmentation model allocates population members to one of five motivation groups based on their health attitudes and beliefs. The model identifies those population segments more likely to look after their own health (‘Health-conscious realists’, ‘Balanced compensators’) and those less likely to look after their own health (‘Unconfident fatalists’, ‘Hedonistic immortals’, ‘Live for todays’). By better understanding the motivating factors underpinning these groups, tailored intervention, engagement and communication formats can be used to greater effect. Note: These labels are used to describe the segments only; they are not labels to be assigned to individuals.
Figure 10 has more details on the clustered behaviours associated with each of these groups and gives the proportion of the Kirklees population in each segment.
Additional background information about Healthy Foundations can be found in a Department of Health toolkit (13).
 |
| Figure 10: Descriptions of Healthy Foundations segments and Kirklees proportions (Data source: 2012 CLiK survey (29)) |
Where do people live?
Population distribution
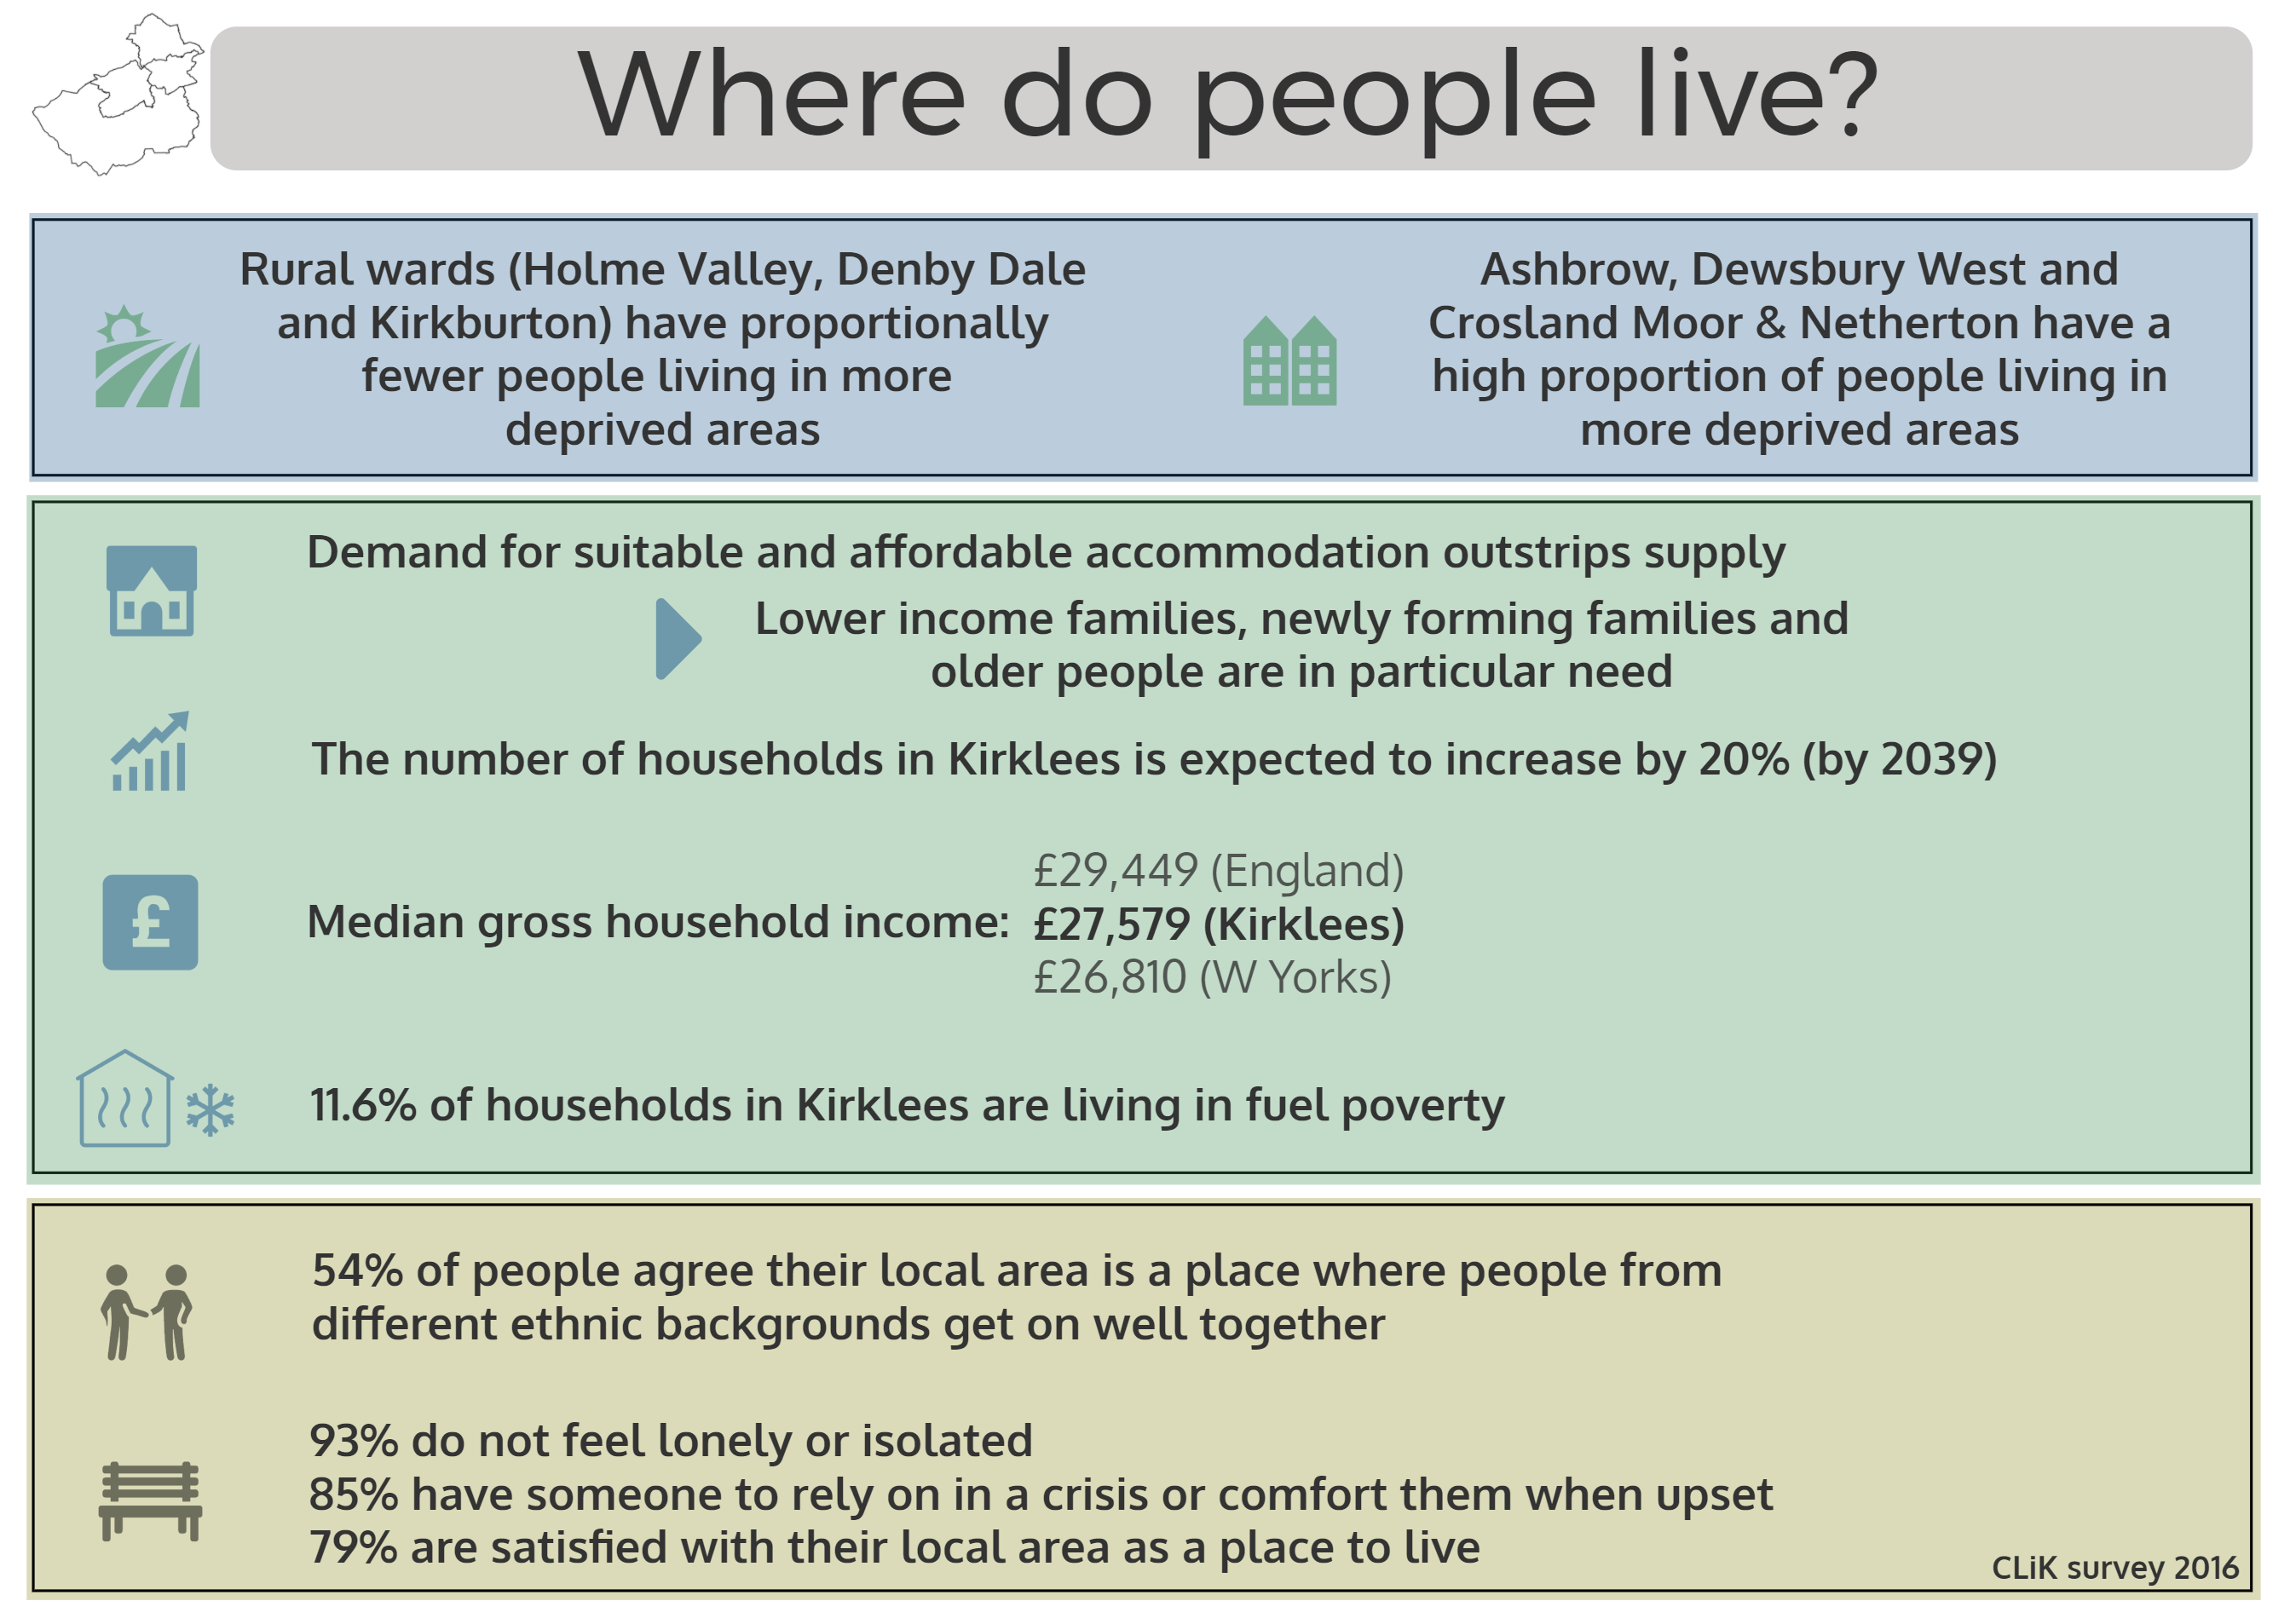
Figure 11 shows the distribution of the Kirklees population by ward and deprivation quintile. Wards with predominantly red bars, including Ashbrow, Dewsbury West, and Crosland Moor & Netherton, have proportionately higher numbers of people living in areas defined as amongst the most deprived 20% in England. Wards in rural parts of Kirklees, including the Holme Valley, Denby Dale and Kirkburton, have proportionately higher numbers of people living in the least deprived quintiles.
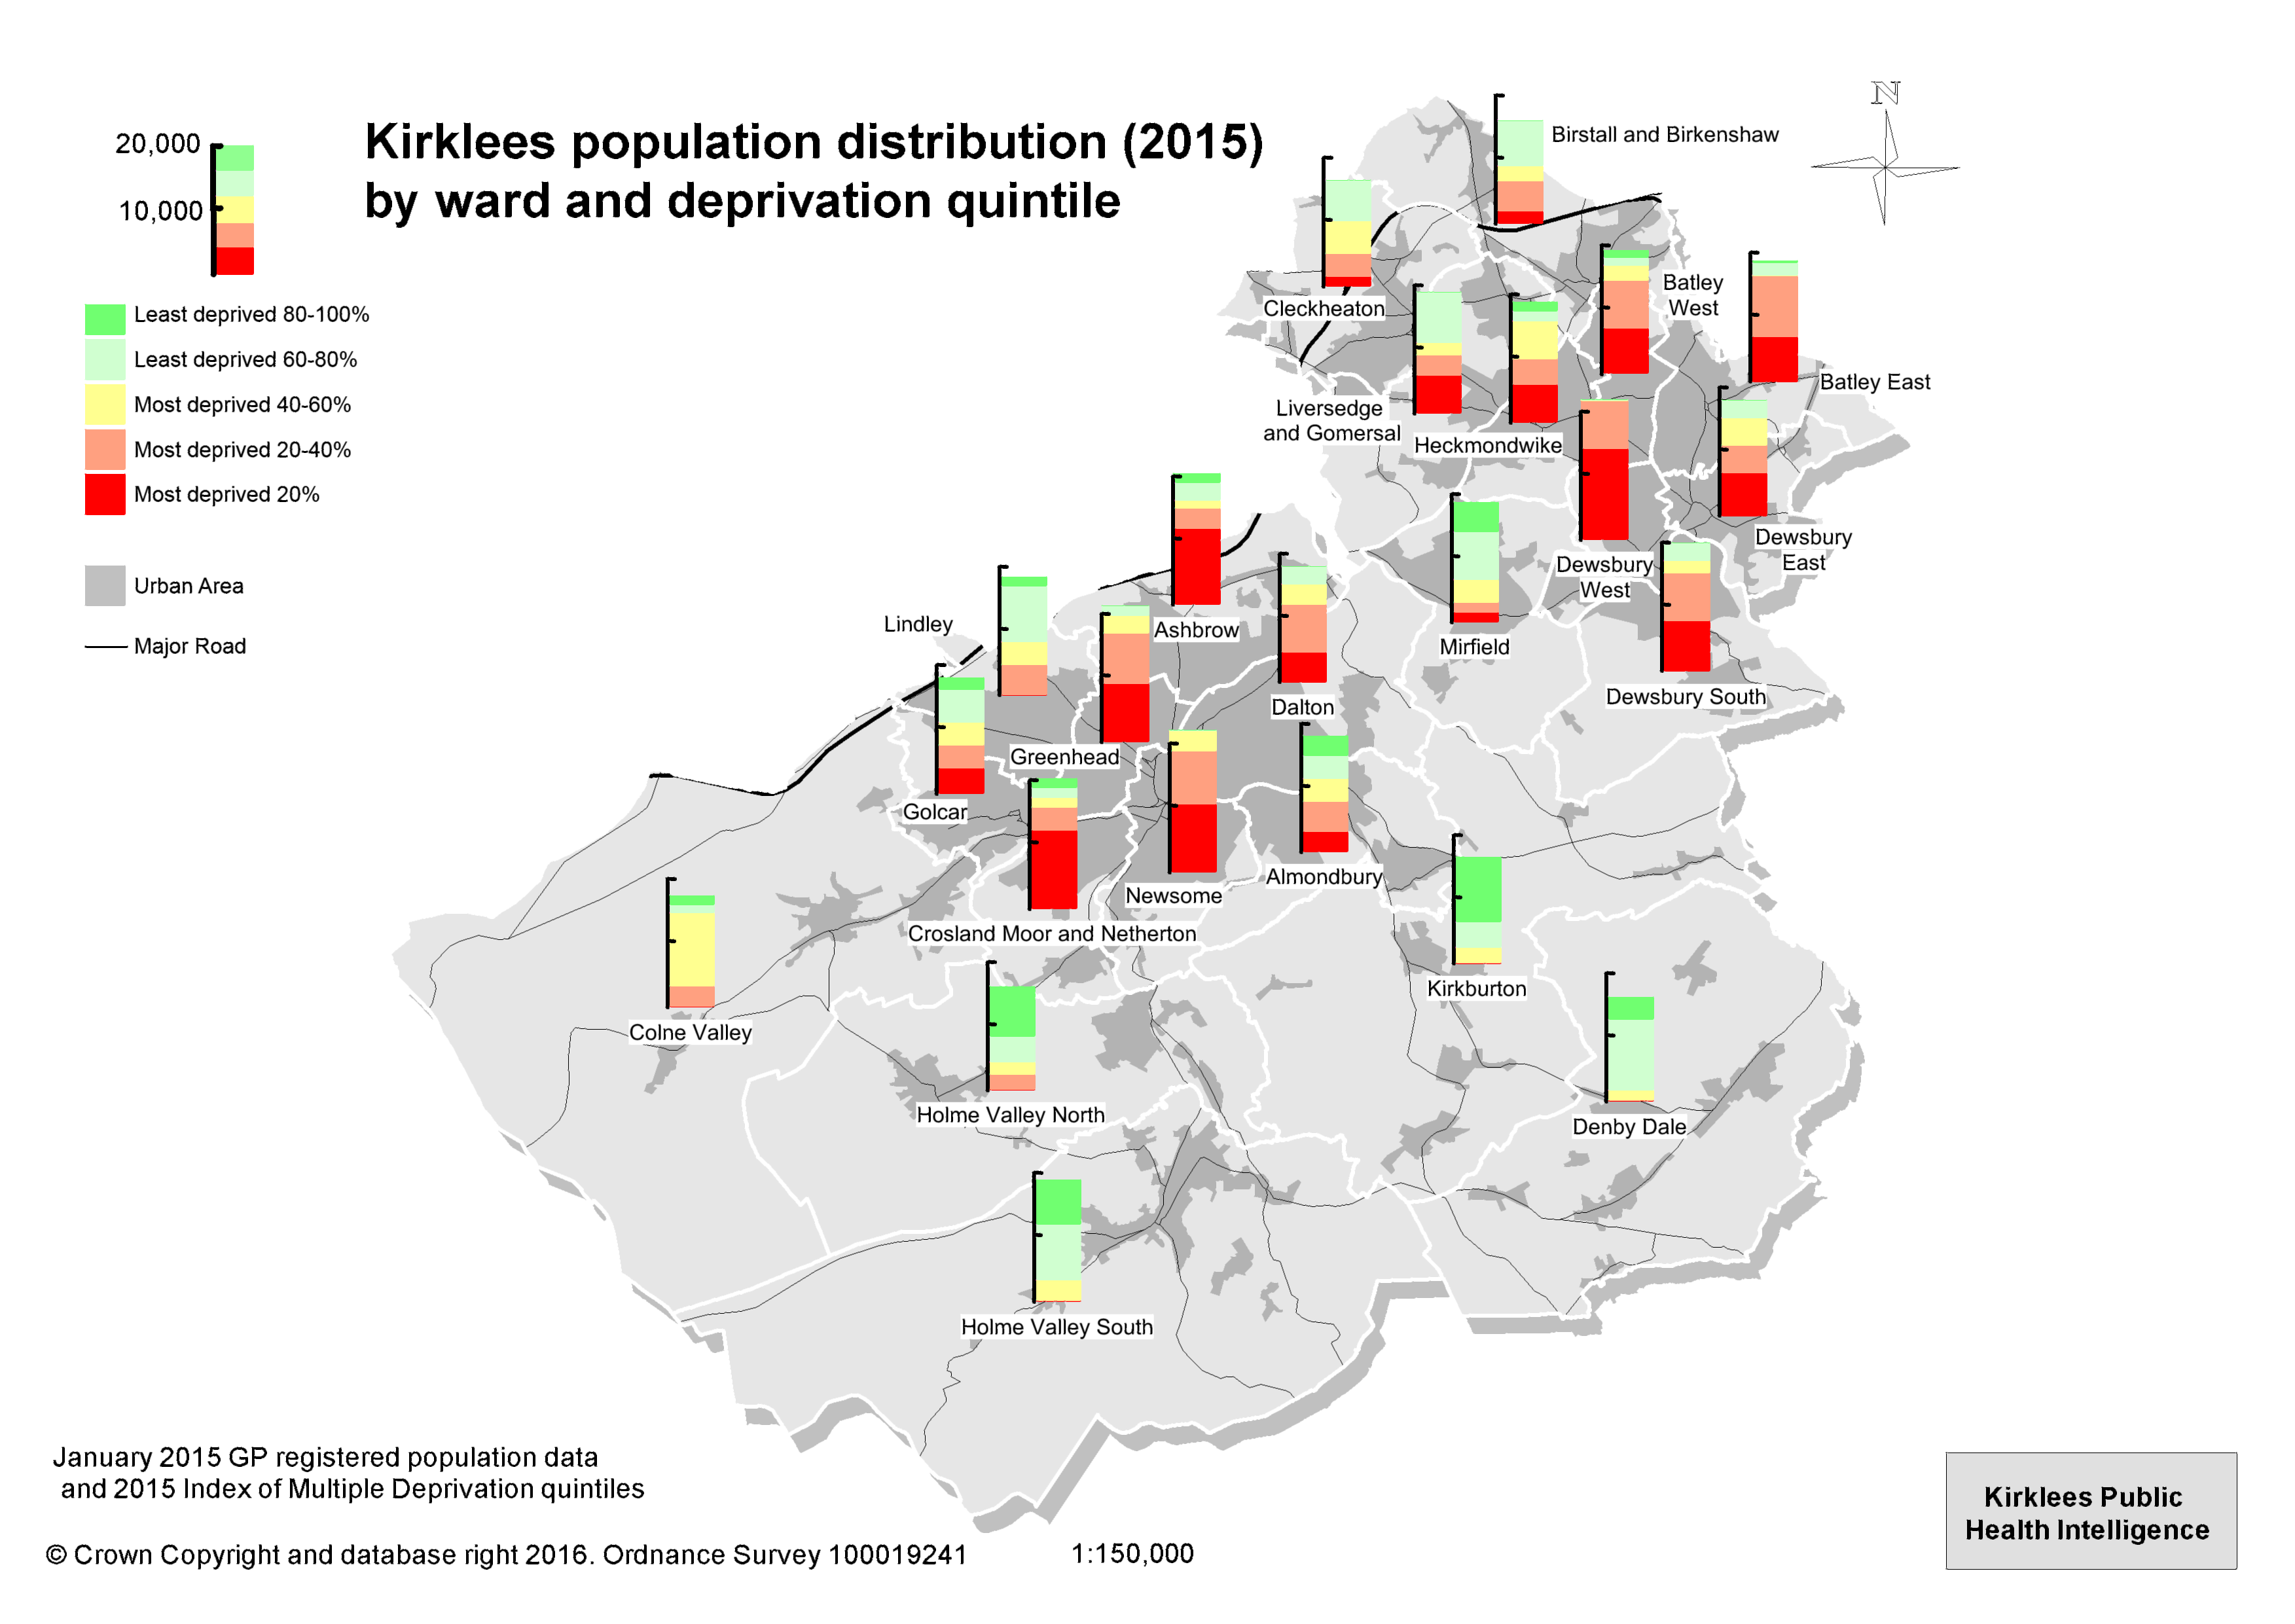 |
| Figure 11: Population distribution by ward and deprivation quintile (Source: Jan 2015 GP registrations, Index of Multiple Deprivation 2015) |
Further information about deprivation in Kirklees (including links to more detailed resources) can be found in the Inequalities section of the KJSA .
Housing and households
The median house price paid in Kirklees in 2015 was £130,000 (Her Majesty’s Land Registry), slightly below the median price paid across West Yorkshire (£134,000). Although Kirklees is one of the more affordable places to live within Yorkshire and Humber, this needs to be seen within the context of low income levels within the district. Demand for suitable and affordable accommodation outstrips the supply, with particular need amongst lower income families, newly forming families and older people.
Further information on the housing situation in Kirklees can be found in the 2015 Kirklees Strategic Housing Market Assessment (14) and in the Housing section of the KJSA. The latest available information on house prices can be found in the housing profile on the Kirklees Observatory.
Household projections (Department for Communities and Local Government, July 2016) (15) suggest that the number of households in Kirklees will rise by 20%, from 178,000 in 2014 to 213,000 in 2039 (Figure 12). In the same period, average household size in Kirklees is predicted to decrease by 5%, from 2.39 to 2.27 people per household.
Note: Household projections are an indication of the likely increase in households given the continuation of recent demographic trends. They are not an assessment of housing need and do not take account of future policies.
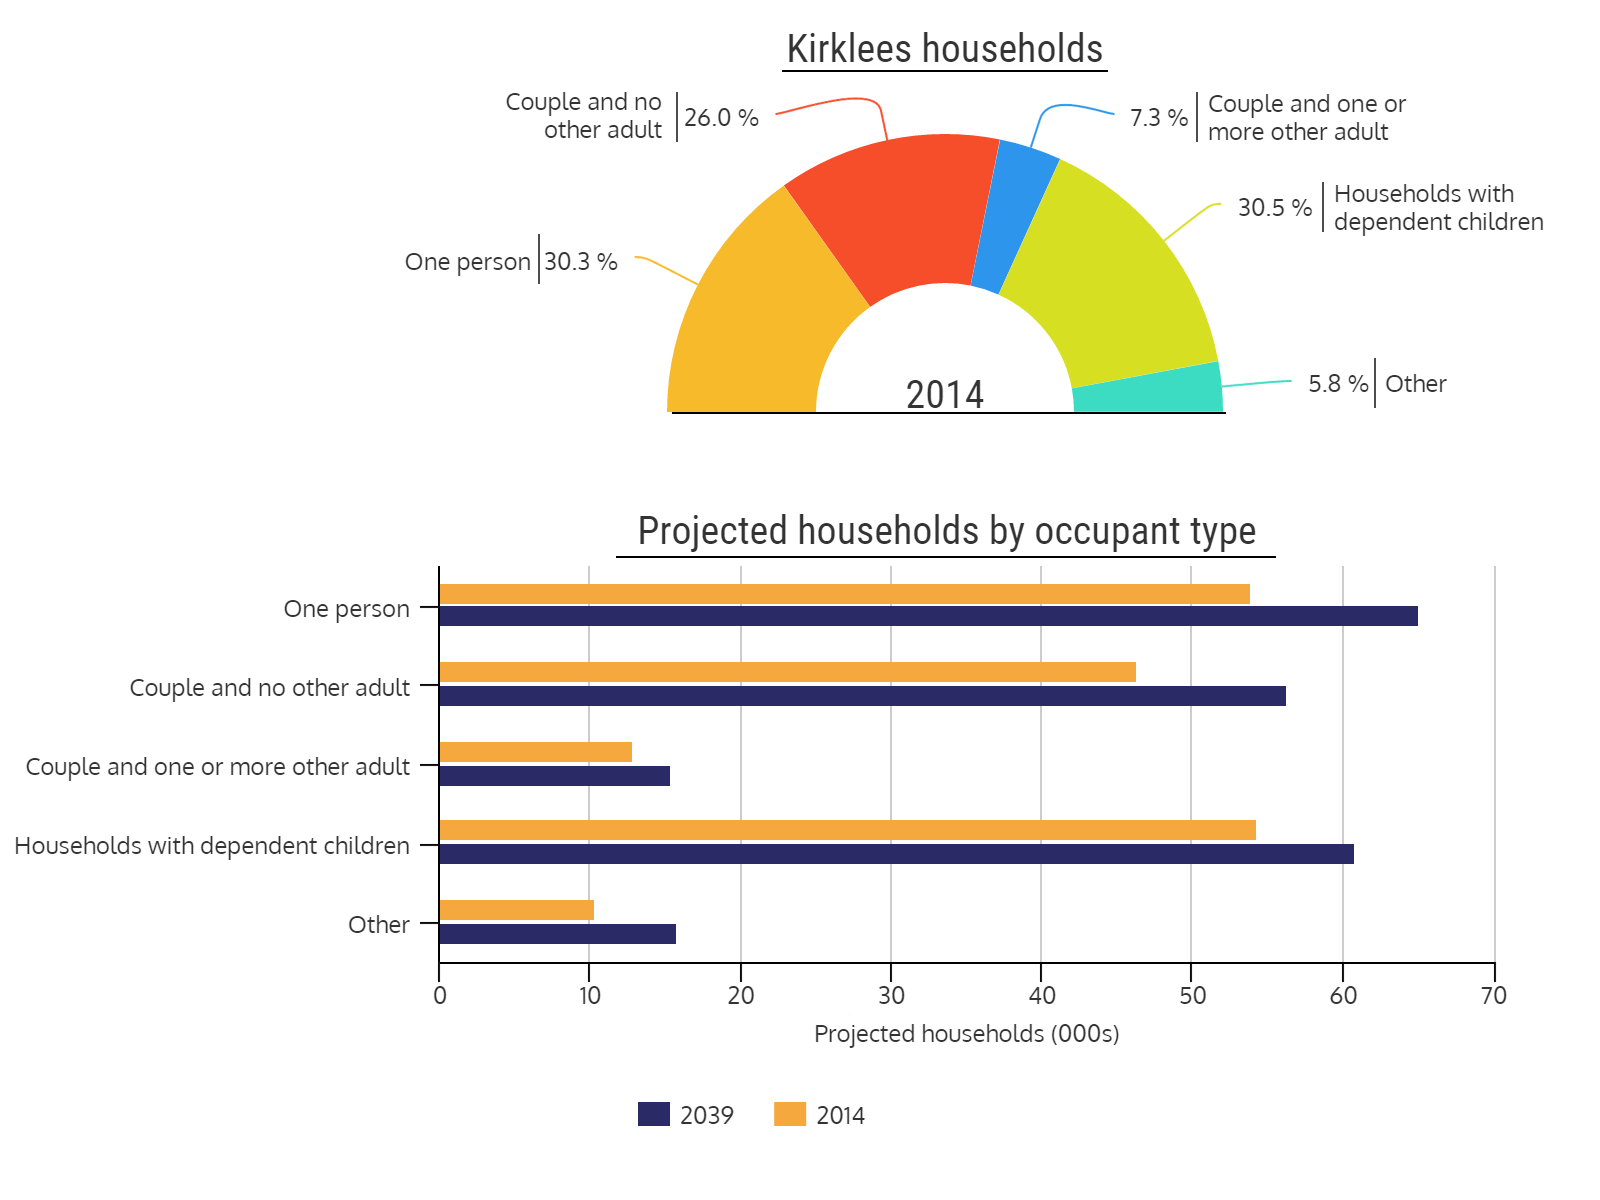 |
| Figure 12: Household composition (2014) and projected number of households (2039) for Kirklees (source: Housing and Planning Analysis Division, DCLG, July 2016 (15)) |
The median gross household income for Kirklees is £27,579, slightly higher than West Yorkshire (£26,810), but less than the England median value (£29,449) (source: CACI Ltd, Paycheck model, June 2016).
An estimated 11.6% of households in Kirklees are living in fuel poverty (2014 estimates from Department for Energy and Climate Change using low income high cost method: 20,361 out of 175,686 households (16)). This compares with 11.8% for the Yorkshire & the Humber region, and 10.6% for England.
Further information on fuel poverty can be found in the Poverty section of the KJSA.
Communities
The large range of ethnicities living in Kirklees contributes to a set of culturally diverse communities. Diversity brings many benefits but may also be associated with increasing local tensions. Just over half of people surveyed in 2016 (54%) agreed that their local area was a place where people from different ethnic backgrounds get on well together, with almost three quarters (74%) of the BME community felt this to be the case (Source: 2016 CLiK adult population survey (6)).
Other findings from the 2016 survey showed that most people do not feel lonely or isolated (7% feel lonely/isolated most or all the time), araound nine out of ten people (85%) have someone to rely on in a crisis or comfort them when upset, and eight out of ten people (79%) are satisfied with their local area as a place to live.
More information on this subject can be found in the KJSA section on community cohesion and social capital.
Selected CLiK survey findings (including those relating to community cohesion) are available as a profile on the Kirklees Observatory.
What do people do?
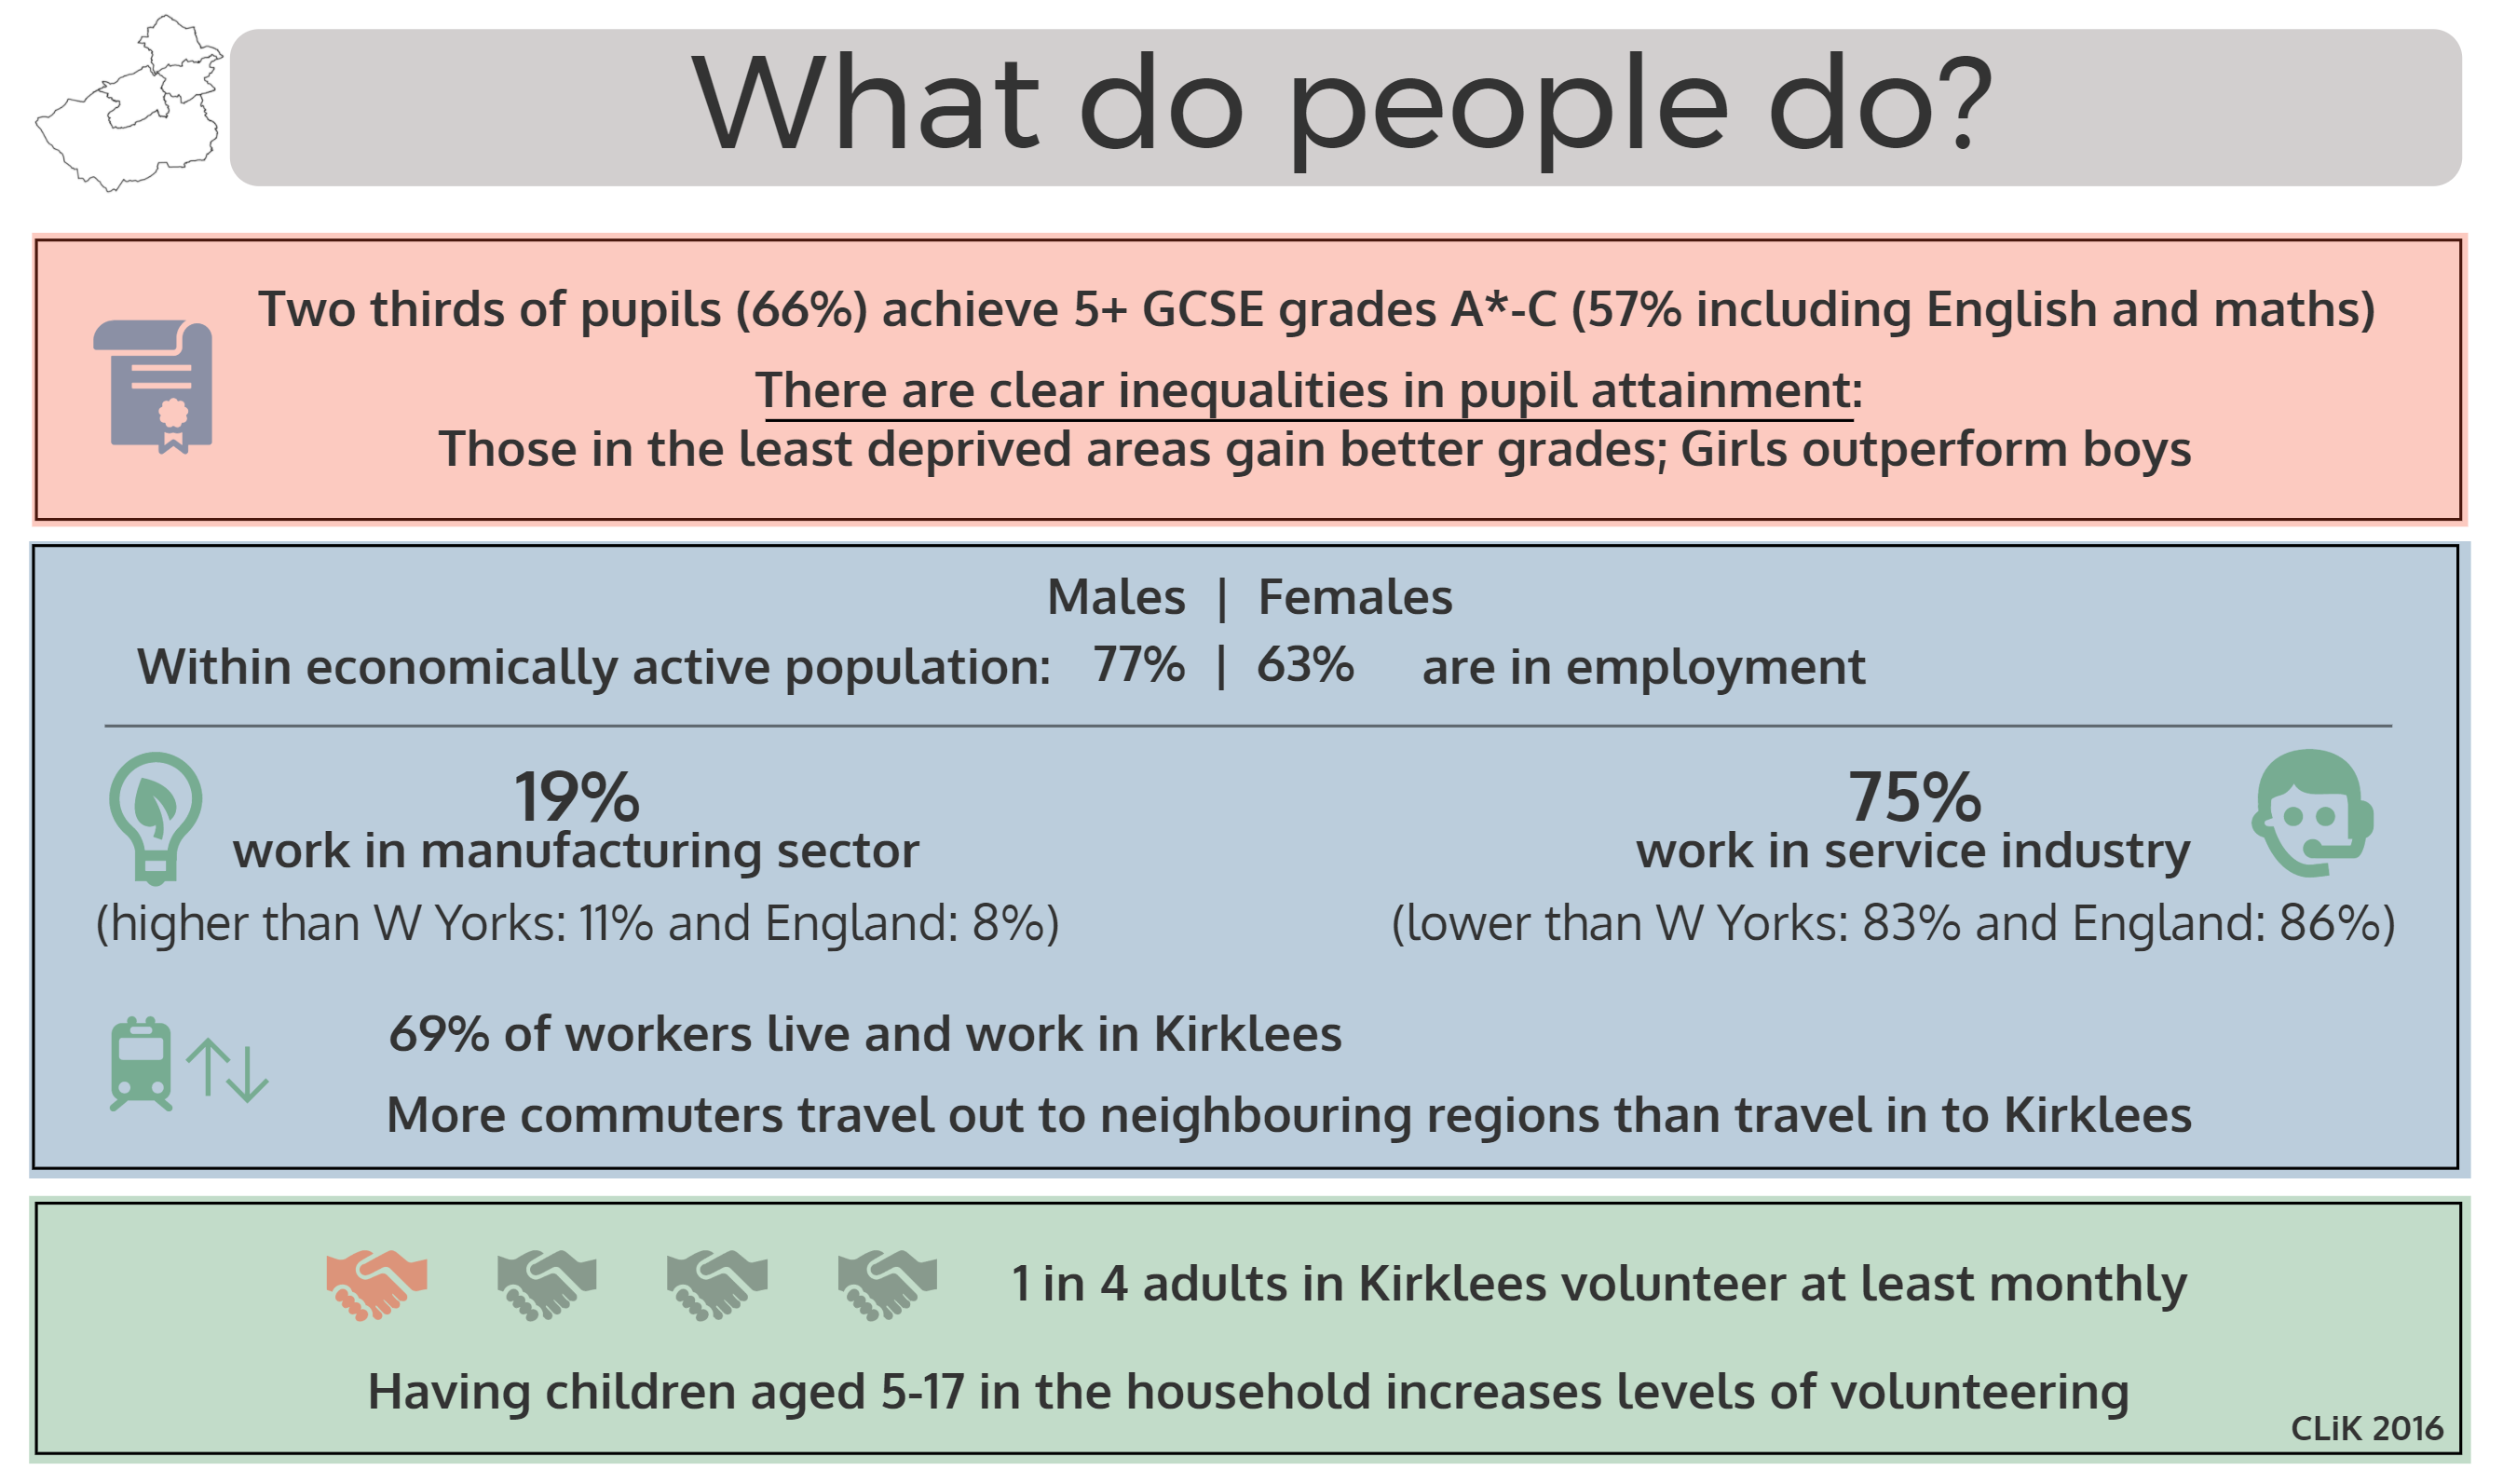
Almost two thirds of Kirklees pupils (65.6%) achieve 5+ GCSEs grade A* to C (56.8% including English and Maths)(17); these are similar to England averages (66.2% and 57.1%, respectively). There are clear inequalities in pupil attainment, with girls outperforming boys, and those in the least deprived areas gaining better grades than those in the most deprived areas – across Kirklees, 57% more pupils gained 5+ GCSEs (grades A*-C inc English and maths) in the least deprived areas compared to those living in the most deprived areas.
A higher percentage of Kirklees resident young people aged 16 and 17 are participating in education or training (91.3%) than the regional (90.7%) and national average (89.5%); participation in apprenticeships for this age group is also above regional and national averages (18). Achievement at level 3 (A level or equivalent) at age 19 (56.9% in Kirklees) is above the regional level (53.7%) but below the national (58.2%) level (18).
70% of the working age population (aged 16-64) are qualified to level 2 or higher (e.g. 5 or more GCSEs at grades A-C, intermediate GNVQ, NVQ 2 or equivalent) (Source: ONS annual population survey 2015 (19)).
Within the economically active population, 77.0% of males and 63.4% of females are in employment (Source and definition: ONS annual population survey 2015 (19)). Amongst those aged 16-64, 2.6% of males and 1.4% of females are claiming out of work benefits (Source: ONS claimant count, May 2016, available via NOMIS: www.nomisweb.co.uk).
Kirklees has a higher proportion of employees working in the manufacturing sector (19% of employees) than West Yorkshire (11%) and England (8%), and a lower proportion working in the service industry (75% Kirklees; 83% West Yorkshire; 86% England) (Source: ONS Business Register and Employment Survey 2014 (20)).
The 2011 census (2) showed a net outflow of commuters to neighbouring regions, with 69% of workers living and working in Kirklees (Figure 13). This illustrates the interdependency between Kirklees and other local economies.
 |
| Figure 13: Principal commuting flows in/out of Kirklees (flows over 500 people) (Source: 2011 census, ONS) |
Further details on these issues can be found in the Kirklees labour market profile on the Nomis web site, in the economy overview on the Kirklees Observatory , in the Kirklees District Strategic Needs Assessment (Post 16 learning and skills), and in the Learning, skills and NEET, work and worklessness section of the KJSA.
A link to the Kirklees Local Economic Assessment 2016 will also be added here when complete.
Volunteering
Volunteering is a vital component of community activity, providing benefits to the volunteer (including reducing social isolation, learning new skills, enhancing employment prospects, and increasing self-confidence) and to the project (including free labour, and establishing links with the local community). The 2012 CLiK survey (6) found that one in four adults (28%) in Kirklees volunteer at least once a month for a club, group or organisation. The survey also found that monthly volunteering levels are highest at retirement age and between ages 45-54 (Figure 14), and that having children aged 5-17 in the household increases levels of volunteering.
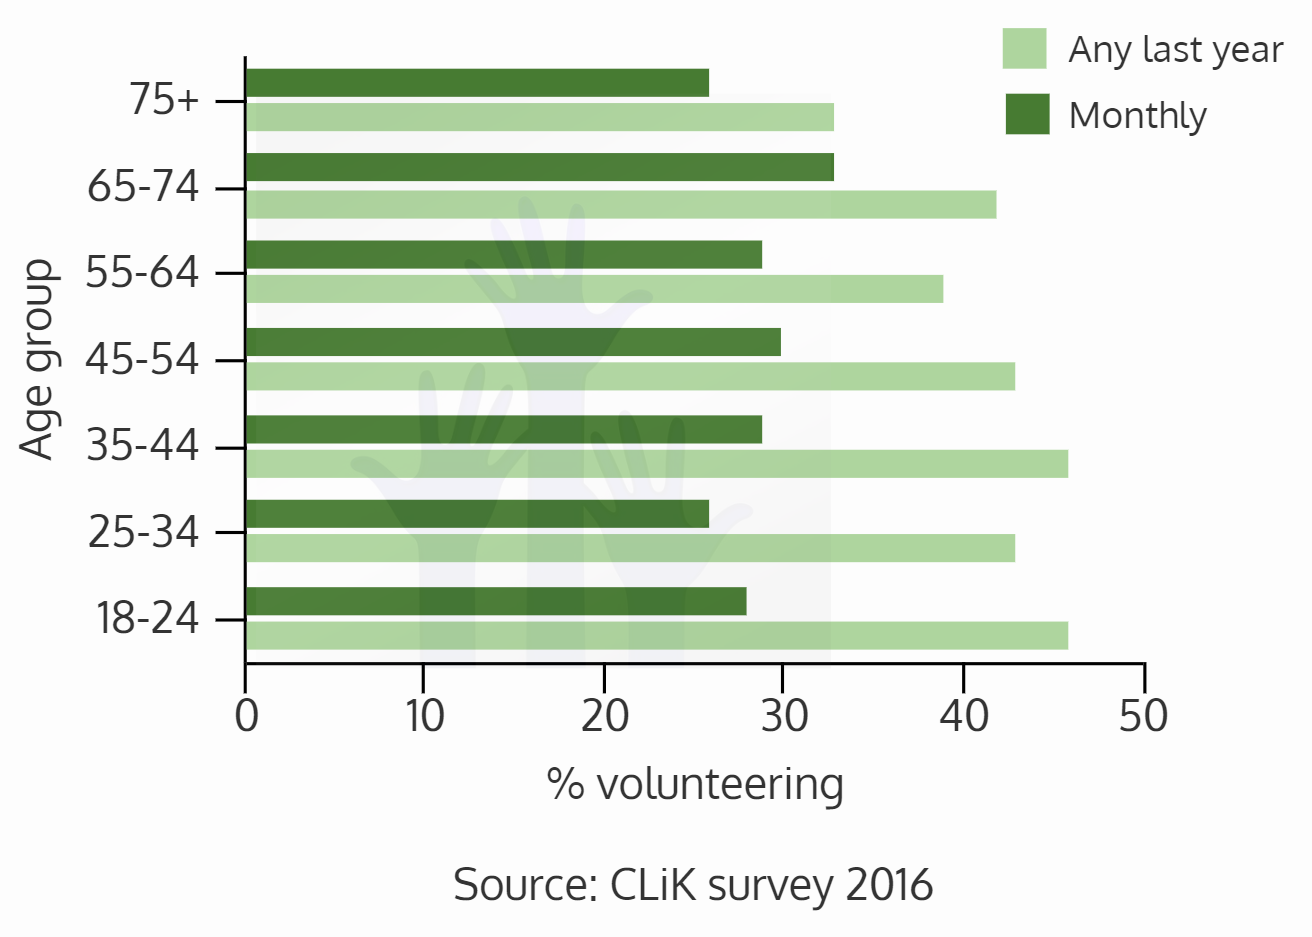 |
| Figure 14: Volunteering levels by age group |
More information on this subject can be found in the KJSA section on community cohesion and social capital.
Additional resources on volunteering in Kirklees can be found here: http://www.kirklees.gov.uk/volunteering.
How is the population changing?
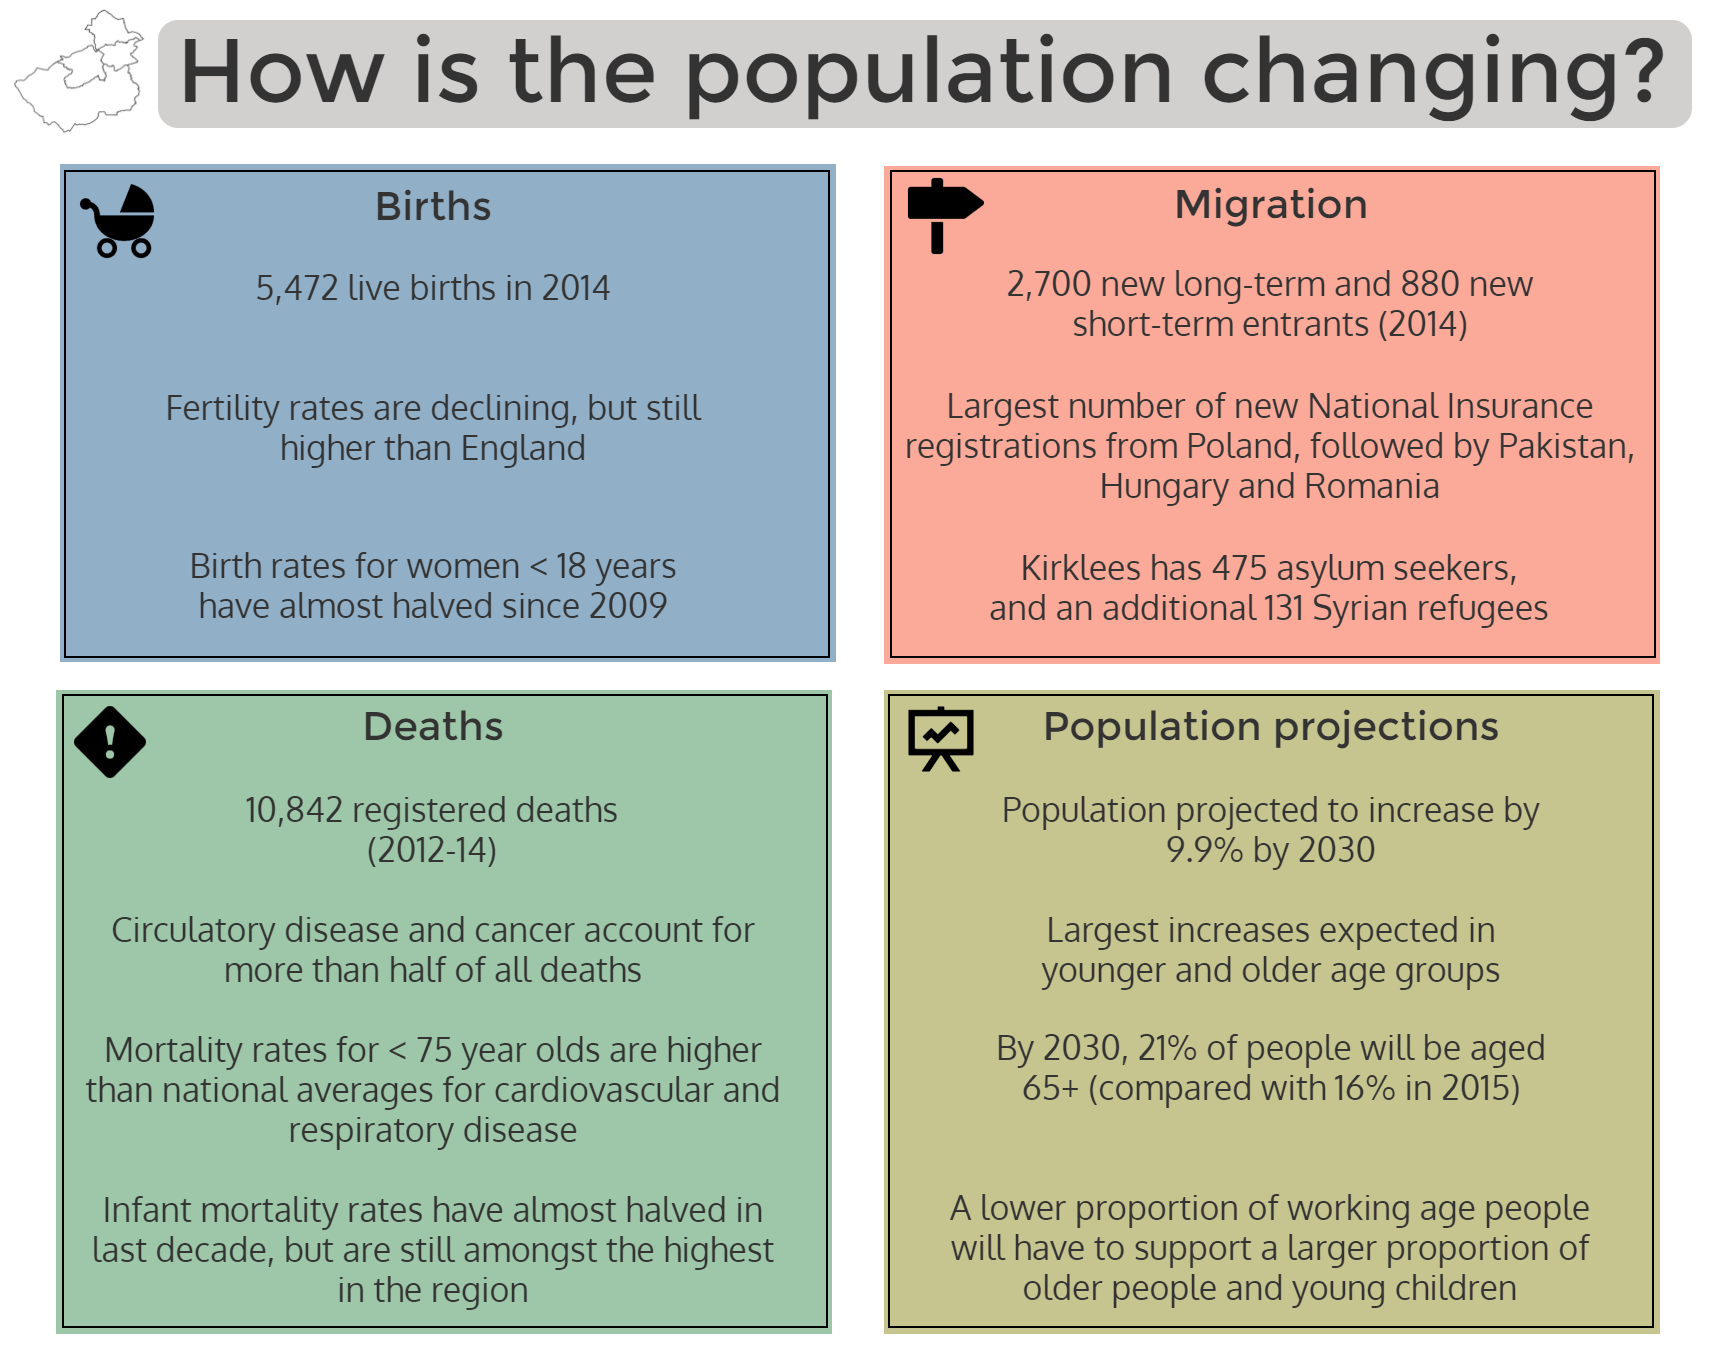
Births
There were 5,472 live births to Kirklees residents in 2014. General and total fertility rates are higher in Kirklees than for England overall (Table 11), but fertility rates are declining.
| Table 11: Summary of births and fertility rates, Kirklees and England |
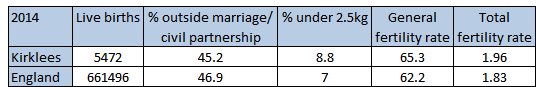 |
| General fertility rate: Number of live births per 1,000 women aged 15-44 Total fertility rate: Average number of children a group of women would bear if they experienced the age-specific fertility rates throughout their childbearing years Source: ONS conception statistics (22) |
Birth rates for women aged under 18 have almost halved since 2009, from 14.2 births per 1000 women aged under 18 in 2009 to 7.3 in 2014 (Figure 15).
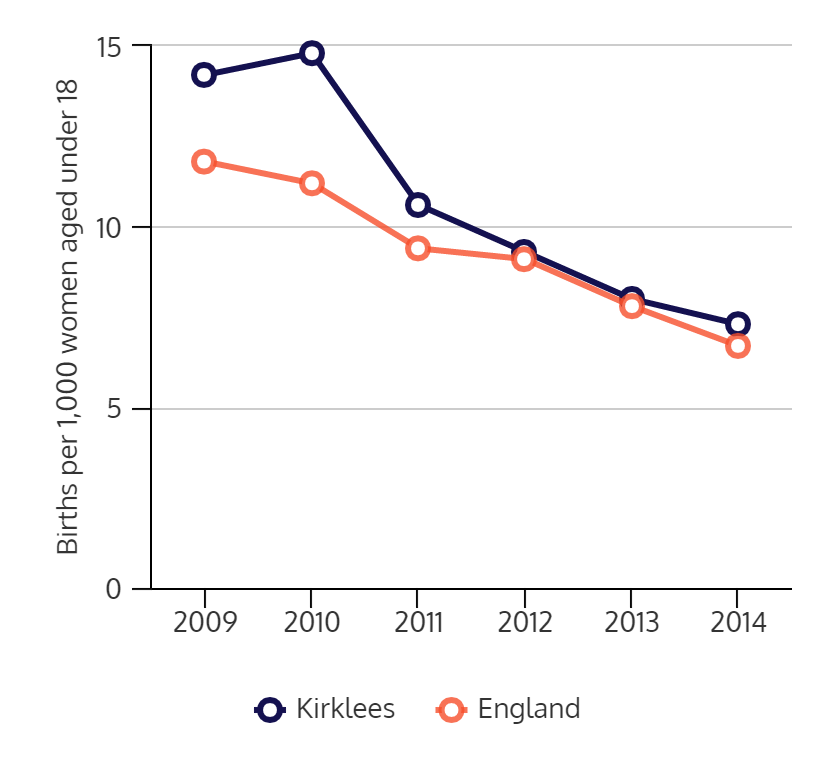 |
| Figure 15: Under 18 birth rates for Kirklees and England, 2009-2014 (22) |
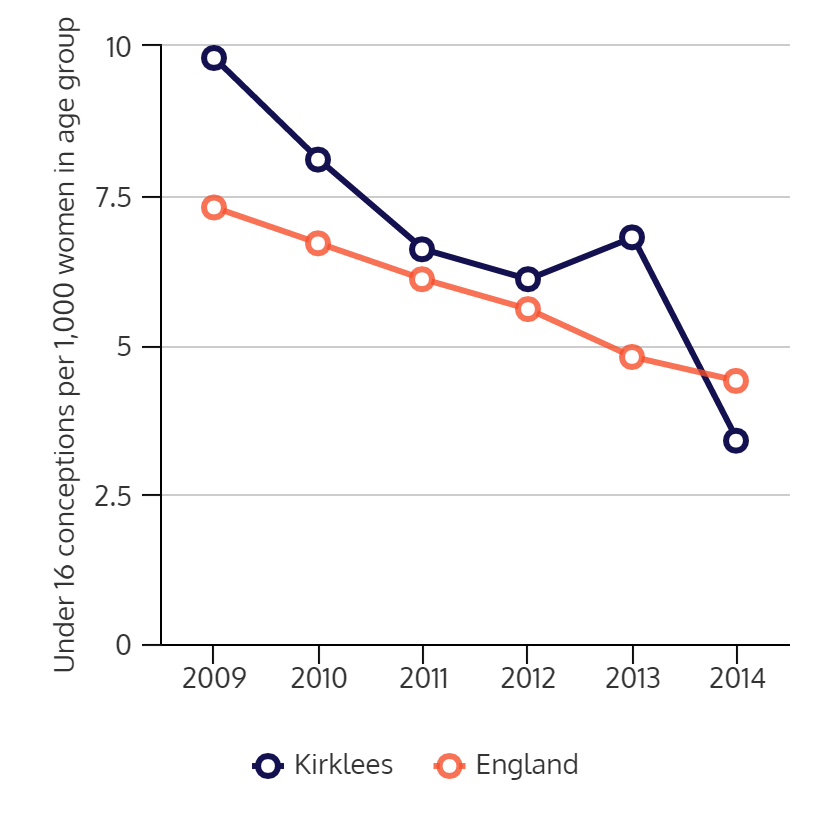
Teenage conception rates also show a decreasing trend, in line with national figures (Figure 16).
 |
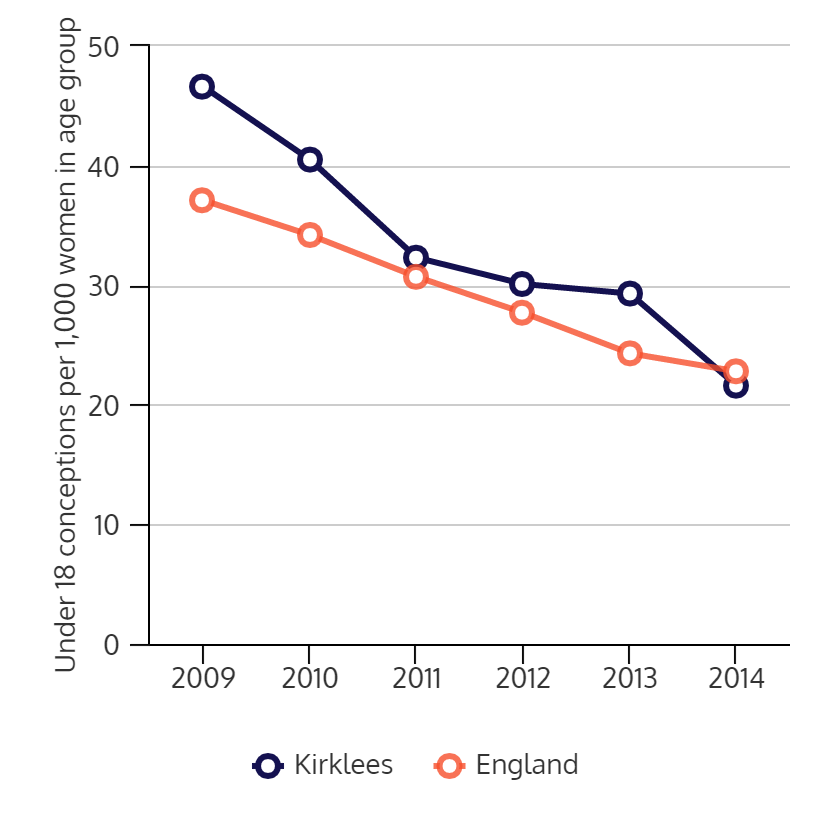 |
| Figure 16: Under 18 (left) and under 16 (right) conception rates, 2009-2014 (22) | |
Deaths
Amongst Kirklees residents, there were 10,842 deaths registered between 2012 and 2014, with circulatory disease and cancer accounting for more than half of all deaths (Table 12).
| Table 12: Cause of death for Kirklees residents, 2012-14 |
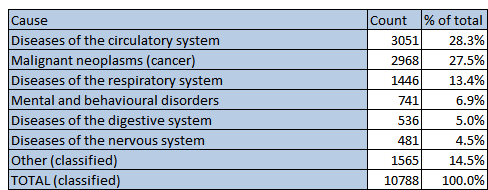 |
| Source: Primary Care Mortality Database |
More details around cause of death by age and sex can be found here.
Directly standardised mortality rates (2012-14) for under-75 year olds are higher than national averages for cardiovascular disease (Kirklees = 82.2; England = 75.7 per 100,000 population) and respiratory disease (Kirklees = 38.4; England = 32.6 per 100,000). Kirklees mortality rates for liver disease and cancer are similar to national rates.
Mortality rates for cardiovascular disease (particularly coronary heart disease) and liver disease are much higher for males than for females (Table 13).
| Table 13: Directly standardised mortality rates per 100,000 population |
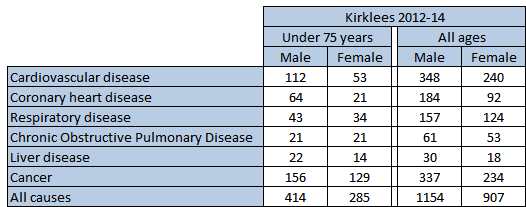 |
| Mortality rates determined using the folllowing ICD-10 codes: cardiovascular disease (I00-I99), coronary heart disease (I20-I25), respiratory disease (J00-J99), COPD (J40-J44), liver disease (B15-B19, C22, I81, I85, K70-K77, T86.4), cancer (C00-C97) Sources: Primary Care Mortality Database (using date of registration of death), GP registered population Jul 2013; 2013 European Standard Population used for standardisation |
All-cause mortality rates in Kirklees declined by 17% (all ages) and 22% (under 75 years) between 2003-05 and 2012-14; mortality rates from circulatory diseases declined by 38% (all ages) and 40% (under 75 years) over the same period.
Infant mortality rates in Kirklees are amongst the highest in the region and are highest in the most deprived areas. However, rates have almost halved in the last decade (2003-05 = 8.0 deaths per 1000 live births; 2012-14 = 4.6) (Figure 17).
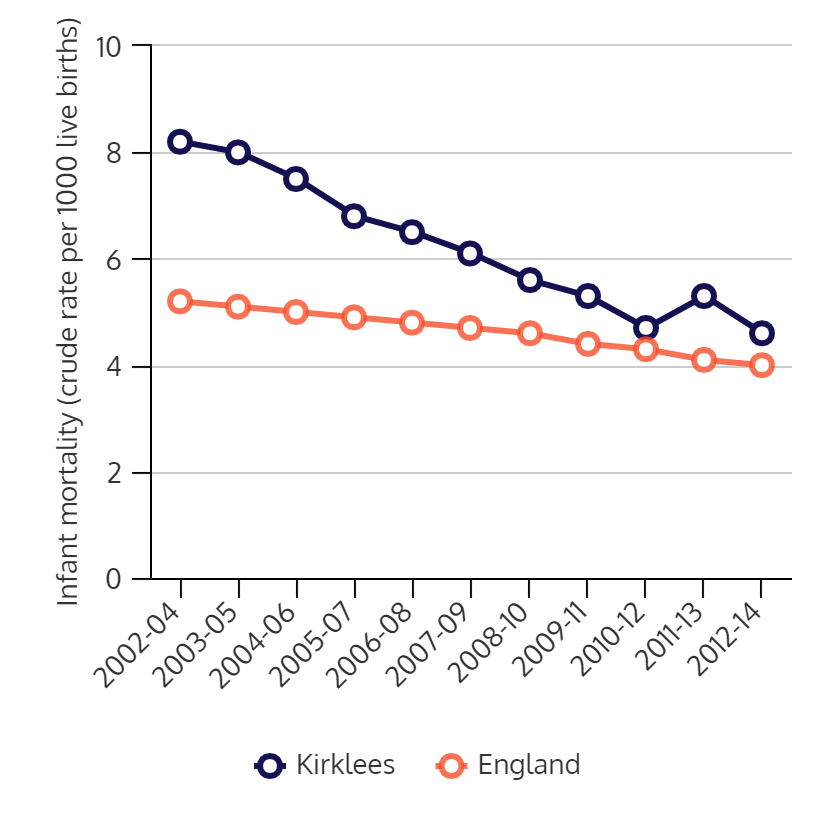 |
| Figure 17: Infant mortality rates (crude rate per 1000 live births) for Kirklees and England (Source: Kirklees data from Primary Care Mortality Database and ONS Births; National figure from Public Health Outcomes Framework (10)) |
Further details on infant mortality can be found in the pregnancy and maternal health section of the KJSA.
Issues of bereavement and end of life are covered in the appropriate KJSA section.
Further details on mortality rates in Kirklees can be found on the Public Health Outcomes Framework web site (10).
Migration and asylum seekers
Along with births and deaths, migration is the third component of population change in Kirklees.
Development of the textile, chemical and engineering industries through the twentieth century attracted people to Kirklees from Ireland, the Caribbean, India and Pakistan. Migrants also arrived following the expansion of the European Union and as a result of conflicts in the Balkans, Middle East and North Africa, with extended family members subsequently moving to join relatives. Recent years have seen significant rises in refugee and asylum seeker entrants, and increasing numbers of European economic migrants.
Problems encountered by European economic migrants on arrival in Kirklees may include poor language skills, lack of information, and limited interaction with appropriate services. Along with adherence to traditions and customs from home countries, these issues can detrimentally affect this group’s capacity to access services when required.
Data from Migration Yorkshire (23) shows that there were 2,700 new long-term (12 months or more) and 880 new short-term entrants to Kirklees in 2014. New National Insurance number registrations (NINR (23)), issued to adults who are working or seeking work and receiving benefits, are shown by nationality in Table 14. It is recognised that NINR does not reflect the actual number of economic migrants, as many workers arrive without official registration – actual migrant numbers are likely to be much higher than officially recorded.
| Table 14: National insurance number registrations in Kirklees by nationality (2011-15) |
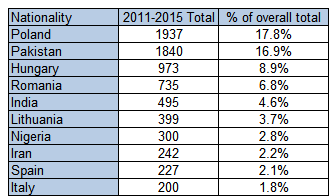 |
| Source: Department for Work and Pensions (24) |
Emerging communities
Although Eastern European migrants are spread throughout the borough, many new migrants choose to live near friends and family already living in the area, creating small concentrations of people from the same countries of origin. For example, there is a concentration of Hungarian families in Birkby, Fartown and Ravensthorpe. Polish families are more widely distributed, with an established group entering the UK before and during the Second World War and a more recent wave of migrants associated with accession to the EU.
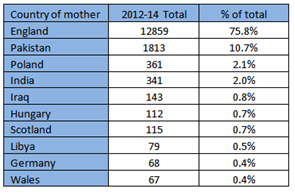
An analysis of mother’s country of birth for births in Kirklees (Table 15) suggests that members of these emerging communities are settling and having families in the region.
| Table 15: Top 10 births in Kirklees by country of mother (2012-2014, ONS) |
 |
Further work is being undertaken to identify and support these emerging communities. A report on emerging communities in relation to maternal and family health (August 2016) (25) can be found here.
Asylum seekers and refugees
An asylum seeker may be defined as a person who has left their country of origin and formally applied for asylum in another country but whose application has not yet been concluded. When an asylum claim is rejected, the individual has limited entitlements and restricted access to free healthcare while arrangements to leave the UK are being made.
A refugee is defined by the 1951 United Nations Convention Relating to the Status of Refugees as: ‘A person who owing to a well-founded fear of being persecuted for reasons of race, religion, nationality, membership of a particular social group or political opinion, is outside the country of his nationality and is unable or, owing to such fear, is unwilling to avail himself of the protection of that country; or who, not having a nationality and being outside the country of his former habitual residence as a result of such events, is unable or, owing to such fear, is unwilling to return to it.’
Asylum seekers and refugees are fleeing persecution and seeking protection, and have a wide range of physical and psychological health needs.
In the second quarter of 2016 there were 536 asylum seekers living in Kirklees (Home Office statistics (26)).In addition, Kirklees Council has agreed to resettle 131 individual Syrians through the national Syrian Refugee resettlement programme (27).
A new section will be added to the KJSA providing more information about asylum seekers and refugees in Kirklees.
Population projections
Population projections estimate future changes in population levels by accounting for experienced and expected levels of births, deaths and migration. According to the 2014 ONS population projections (released June 2016) (28), the population of Kirklees will increase by 9.9 % between 2014 and 2030 (from 431,020 to 473,595).
Note: ONS population estimates tend to be lower than population counts based on GP registers. Although GP registration-based population counts are reliant on people registering with a GP and updating their details when they change address, they are generally considered to be a more accurate reflection of the true population count than ONS estimates. In this population section, GP registration counts are used when referring to actual/historical population numbers and ONS numbers are used for future population projections.
Figure 18 shows the differences in actual population (GP registrations) between 2002 and 2015 alongside the differences between actual 2015 and projected 2030 populations (ONS projections, 2014 base (28)). The largest projected increases are in the younger and older age groups, with projected decreases in the 25-34 and 45-54 age groups.
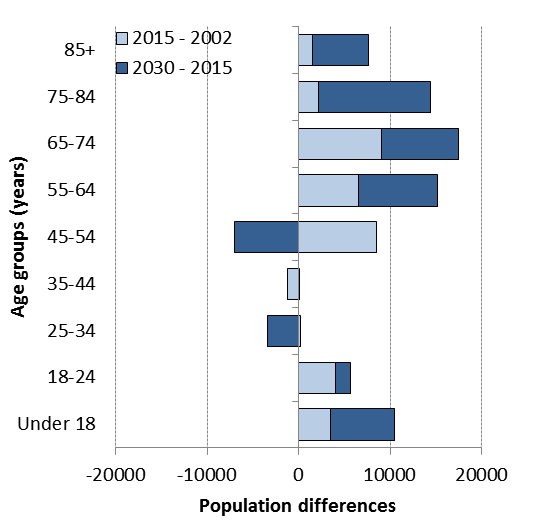 |
| Figure 18: Actual difference in population between 2015 and 2002 (light blue); Projected difference in population between 2030 and 2015 (dark blue) (Sources: Actual population from GP registrations, projected populations from ONS) |
Figure 19 shows the changes in population over time (2002-2015 actual and 2016-2030 projected) along with dependency ratio calculations (those aged under 15 + those over 64 years versus those aged 15 to 64 years). An increase in the dependency ratio (from 53% in 2015 to 65% in 2030) suggests that a lower proportion of working age people will have to support a larger proportion of older people and young children.
 |
| Figure 19: Actual (2002-2015) and projected (2016-2030) populations and dependency ratios (animated gif) |
References and additional resources
References
- Datashine. Mapped 2011 census data [Internet]. 2016 [cited 2016 Sep 30]. Available from: http://datashine.org.uk
- Office for National Statistics. Census data [Internet]. 2011 [cited 2016 Jul 8]. Available from: https://www.ons.gov.uk/census/2011census/2011censusdata
- Department for Education. Schools, pupils and their characteristics: January 2016 [Internet]. 2016 [cited 2016 Sep 30]. Available from: https://www.gov.uk/government/statistics/schools-pupils-and-their-characteristics-january-2016
- UK Government. Equality Act 2010 [Internet]. 2010 [cited 2016 Sep 30]. Available from: http://www.legislation.gov.uk/ukpga/2010/15/contents
- Equality and Human Rights Commission. Protected characteristics [Internet]. 2016 [cited 2016 Sep 30]. Available from: https://www.equalityhumanrights.com/en/equality-act/protected-characteristics
- Kirklees Council, NHS Greater Huddersfield CCG, NHS North Kirklees CCG. Current Living in Kirklees Survey 2016. 2016.
- NHS Kirklees, Council K. CLiK Qualitative Research Report No. 5: Lesbian, Gay, Bisexual & Transgender (LGBT) 18-24 year-olds [Internet]. 2011. Available from: http://www.kirklees.gov.uk/involve/publisheddoc.aspx?ref=c16gcfz1&e=91
- Kirklees Council. PEARLS (Person-based Evidence And Real Life Stories): Health Behaviours Insight Summary 2014 [Internet]. 2014 [cited 2016 Sep 30]. Available from: https://web.archive.org/web/20150619015101/http://www.kirklees.gov.uk/you-kmc/partners/other/pearls.aspx
- Mercer CH, Tanton C, Prah P, Erens B, Sonnenberg P, Clifton S, et al. Changes in sexual attitudes and lifestyles in Britain through the life course and over time: Findings from the National Surveys of Sexual Attitudes and Lifestyles (Natsal). Lancet [Internet]. 2013;382(9907):1781–94. Available from: http://dx.doi.org/10.1016/S0140-6736(13)62035-8
- Public Health England. Public Health Outcomes Framework [Internet]. 2016 [cited 2016 Sep 30]. Available from: http://www.phoutcomes.info
- Department for Communities and Local Government. English indices of deprivation 2015 [Internet]. 2015 [cited 2016 Sep 30]. Available from: https://www.gov.uk/government/statistics/english-indices-of-deprivation-2015.
- Public Health England. The segment tool: Segmenting life expectancy gaps by cause of death [Internet]. 2016 [cited 2016 Sep 30]. Available from: http://fingertips.phe.org.uk/profile/segment/area-search-results/E12000003?search_type=list-child-areas&place_name=Yorkshire and the Humber
- Department of Health. Healthy Foundations Life-stage Segmentation Model Toolkit [Internet]. 2010. Available from: https://web.archive.org/web/20170317135639/http://www.cancerresearchuk.org/prod_consump/groups/cr_common/@nre/@hea/documents/generalcontent/cr_045215.pdf
- Kirklees Council. Kirklees Strategic Housing Market Assessment 2015 [Internet]. 2015. Available from: http://www.kirklees.gov.uk/beta/planning-policy/pdf/strategic-housing-market-assessment.pdf
- Department for Communities and Local Government. Live tables on household projections [Internet]. 2016 [cited 2016 Sep 30]. Available from: https://www.gov.uk/government/statistical-data-sets/live-tables-on-household-projections
- Department of Energy & Climate Change. 2014 sub-regional fuel poverty data: low income high costs indicator [Internet]. 2016 [cited 2016 Sep 30]. Available from: https://www.gov.uk/government/statistics/2014-sub-regional-fuel-poverty-data-low-income-high-costs-indicator
- Department for Education. Revised GCSE and equivalent results in England: 2014 to 2015 [Internet]. 2016 [cited 2016 Sep 30]. Available from: https://www.gov.uk/government/statistics/revised-gcse-and-equivalent-results-in-england-2014-to-2015
- Kirklees Council. West Yorkshire Area Review – Post 16 learning and skills. Kirklees District Strategic Needs Assessment [Internet]. 2016. Available from: http://observatory.kirklees.gov.uk/wp-content/uploads/Kirklees-District-SNA-Appendix-1-2018.pdf
- NOMIS. Annual population survey [Internet]. 2016 [cited 2016 Sep 30]. Available from: https://www.nomisweb.co.uk/articles/932.aspx
- Office for National Statistics. UK business register and employment survey (BRES) [Internet]. 2016 [cited 2016 Sep 30]. Available from: http://www.ons.gov.uk/
- Kirklees Council. Your Place Your Say (local survey). 2011.
- Office for National Statistics. Conception statistics, England and Wales [Internet]. 2016 [cited 2016 Sep 30]. Available from: https://www.ons.gov.uk
- Migration Yorkshire. Local migration profile summary: Kirklees [Internet]. 2016 [cited 2016 Sep 30]. Available from: http://www.migrationyorkshire.org.uk/?page=kirkleesinyourarea
- Department for Work and Pensions. National Insurance number allocations to adult overseas nationals entering the UK [Internet]. 2016 [cited 2016 Sep 30]. Available from: https://www.gov.uk/government/collections/national-insurance-number-allocations-to-adult-overseas-nationals-entering-the-uk
- Haigh D, White M. Emerging Communities in Kirklees – Maternal and Family Health [Internet]. 2016. Available from: https://www.kirklees.gov.uk/involve/publisheddoc.aspx?ref=024pmsvj&e=862
- Home Office. National statistics: Asylum [Internet]. 2016. Available from: https://www.gov.uk/government/publications/immigration-statistics-april-to-june-2016/asylum
- Local Government Association, Migration Yorkshire. Syrian refugee resettlement: A guide for local authorities [Internet]. 2016. Available from: https://www.local.gov.uk/syrian-refugee-resettlement-guide-local-authorities
- Office for National Statistics. Subnational population projections for England: 2014-based projections [Internet]. 2016 [cited 2016 Sep 30]. Available from: https://www.ons.gov.uk/
- NHS Kirklees, Kirklees Council. Current Living in Kirklees Survey 2012. 2012.
Additional resources
Kirklees factsheets: http://www.kirklees.gov.uk/beta/information-and-data/kirklees-information.aspx
Date this section was last reviewed
07/10/2016 (CLiK data updated 01/03/17; life expectancy data updated 14/03/17)